Sallie Mae 2010 Annual Report Download - page 73
Download and view the complete annual report
Please find page 73 of the 2010 Sallie Mae annual report below. You can navigate through the pages in the report by either clicking on the pages listed below, or by using the keyword search tool below to find specific information within the annual report.-
 1
1 -
2
-
3
-
4
-
5
-
6
-
7
-
8
-
9
-
10
-
11
-
12
-
13
-
14
-
15
-
16
-
17
-
18
-
19
-
20
-
21
-
22
-
23
-
24
-
25
-
26
-
27
-
28
-
29
-
30
-
31
-
32
-
33
-
34
-
35
-
36
-
37
-
38
-
39
-
40
-
41
-
42
-
43
-
44
-
45
-
46
-
47
-
48
-
49
-
50
-
51
-
52
-
53
-
54
-
55
-
56
-
57
-
58
-
59
-
60
-
61
-
62
-
 63
63 -
 64
64 -
 65
65 -
 66
66 -
 67
67 -
 68
68 -
 69
69 -
 70
70 -
 71
71 -
 72
72 -
 73
73 -
 74
74 -
 75
75 -
 76
76 -
 77
77 -
 78
78 -
 79
79 -
 80
80 -
 81
81 -
 82
82 -
 83
83 -
84
-
85
-
86
-
87
-
88
-
89
-
90
-
91
-
92
-
93
-
94
-
95
-
96
-
97
-
98
-
99
-
100
-
101
-
102
-
103
-
104
-
105
-
106
-
107
-
108
-
109
-
110
-
111
-
112
-
113
-
114
-
115
-
116
-
117
-
118
-
119
-
120
-
121
-
122
-
123
-
124
-
125
-
126
-
127
-
128
-
129
-
130
-
131
-
132
-
133
-
134
-
135
-
136
-
137
-
138
-
139
-
140
-
141
-
142
-
143
-
144
-
145
-
146
-
147
-
148
-
149
-
150
-
151
-
152
-
153
-
154
-
155
-
156
-
157
-
158
-
159
-
160
-
161
-
162
-
163
-
164
-
165
-
166
-
167
-
168
-
169
-
170
-
171
-
172
-
173
-
174
-
175
-
176
-
177
-
178
-
179
-
180
-
181
-
182
-
183
-
184
-
185
-
186
-
187
-
188
-
189
-
190
-
191
-
192
-
193
-
194
-
195
-
196
-
197
-
198
-
199
-
200
-
201
-
202
-
203
-
204
-
205
-
206
-
207
-
208
-
209
-
210
-
211
-
212
-
213
-
214
-
215
-
216
-
217
-
218
-
219
-
220
-
221
-
222
-
223
-
224
-
225
-
226
 |
 |
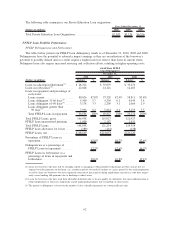
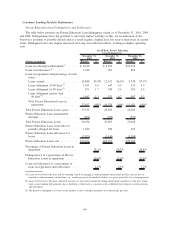
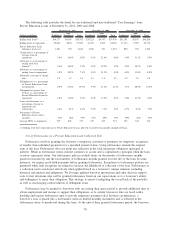
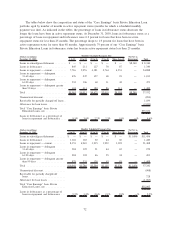
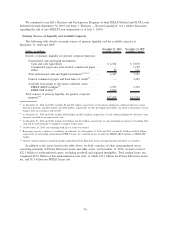
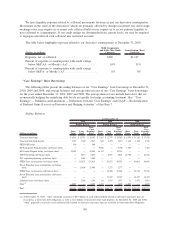
The tables below show the composition and status of the “Core Earnings” basis Private Education Loan
portfolio aged by number of months in active repayment status (months for which a scheduled monthly
payment was due). As indicated in the tables, the percentage of loans in forbearance status decreases the
longer the loans have been in active repayment status. At December 31, 2010, loans in forbearance status as a
percentage of loans in repayment and forbearance were 6.2 percent for loans that have been in active
repayment status for less than 25 months. The percentage drops to 1.9 percent for loans that have been in
active repayment status for more than 48 months. Approximately 79 percent of our “Core Earnings” basis
Private Education Loans in forbearance status has been in active repayment status less than 25 months.
(Dollars in millions)
December 31, 2010 1 to 12 13 to 24 25 to 36 37 to 48 More than 48
Not Yet in
Repayment Total
Monthly Scheduled Payments Due
Loans in-school/grace/deferment . . . . . . . . $ — $ — $ — $ — $ — $8,340 $ 8,340
Loans in forbearance . . . . . . . . . . . . . . . . 845 211 127 70 87 — 1,340
Loans in repayment — current. . . . . . . . . . 7,716 5,976 4,181 2,764 4,251 — 24,888
Loans in repayment — delinquent
31-60 days . . . . . . . . . . . . . . . . . . . . . 476 247 127 68 93 — 1,011
Loans in repayment — delinquent
61-90 days . . . . . . . . . . . . . . . . . . . . . 232 106 60 31 42 — 471
Loans in repayment — delinquent greater
than 90 days . . . . . . . . . . . . . . . . . . . . 694 411 180 86 111 — 1,482
Total . . . . . . . . . . . . . . . . . . . . . . . . . . . $9,963 $6,951 $4,675 $3,019 $4,584 $8,340 37,532
Unamortized discount. . . . . . . . . . . . . . . . (894)
Receivable for partially charged-off loans . . 1,039
Allowance for loan losses . . . . . . . . . . . . . (2,021)
Total “Core Earnings” basis Private
Education Loans, net . . . . . . . . . . . . . . $35,656
Loans in forbearance as a percentage of
loans in repayment and forbearance . . . . 8.5% 3.0% 2.7% 2.3% 1.9% —% 4.6%
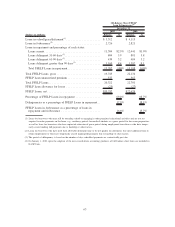
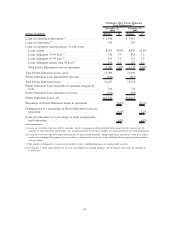
(Dollars in millions)
December 31, 2009 1 to 12 13 to 24 25 to 36 37 to 48 More than 48
Not Yet in
Repayment Total
Monthly Scheduled Payments Due
Loans in-school/grace/deferment . . . . . . . $ — $ — $ — $ — $ — $11,456 $11,456
Loans in forbearance . . . . . . . . . . . . . . . 1,041 183 92 44 60 — 1,420
Loans in repayment — current . . . . . . . . . 8,153 4,969 3,235 1,959 3,092 — 21,408
Loans in repayment — delinquent
31-60 days. . . . . . . . . . . . . . . . . . . . . 584 195 91 44 65 — 979
Loans in repayment — delinquent
61-90 days. . . . . . . . . . . . . . . . . . . . . 284 102 46 25 34 — 491
Loans in repayment — delinquent greater
than 90 days . . . . . . . . . . . . . . . . . . . 879 331 130 63 85 — 1,488
Total . . . . . . . . . . . . . . . . . . . . . . . . . . $10,941 $5,780 $3,594 $2,135 $3,336 $11,456 37,242
Unamortized discount . . . . . . . . . . . . . . . (908)
Receivable for partially charged-off
loans . . . . . . . . . . . . . . . . . . . . . . . . . 728
Allowance for loan losses . . . . . . . . . . . . (1,967)
Total “Core Earnings” basis Private
Education Loans, net . . . . . . . . . . . . . $35,095
Loans in forbearance as a percentage of
loans in repayment and forbearance . . . 9.5% 3.2% 2.6% 2.1% 1.8% —% 5.5%
72