Sallie Mae 2010 Annual Report Download - page 176
Download and view the complete annual report
Please find page 176 of the 2010 Sallie Mae annual report below. You can navigate through the pages in the report by either clicking on the pages listed below, or by using the keyword search tool below to find specific information within the annual report.-
 1
1 -
2
-
3
-
4
-
5
-
6
-
7
-
8
-
9
-
10
-
11
-
12
-
13
-
14
-
15
-
16
-
17
-
18
-
19
-
20
-
21
-
22
-
23
-
24
-
25
-
26
-
27
-
28
-
29
-
30
-
31
-
32
-
33
-
34
-
35
-
36
-
37
-
38
-
39
-
40
-
41
-
42
-
43
-
44
-
45
-
46
-
47
-
48
-
49
-
50
-
51
-
52
-
53
-
54
-
55
-
56
-
57
-
58
-
59
-
60
-
61
-
62
-
63
-
64
-
65
-
66
-
67
-
68
-
69
-
70
-
71
-
72
-
73
-
74
-
75
-
76
-
77
-
78
-
79
-
80
-
81
-
82
-
83
-
84
-
85
-
86
-
87
-
88
-
89
-
90
-
91
-
92
-
93
-
94
-
95
-
96
-
97
-
98
-
99
-
100
-
101
-
102
-
103
-
104
-
105
-
106
-
107
-
108
-
109
-
110
-
111
-
112
-
113
-
114
-
115
-
116
-
117
-
118
-
119
-
120
-
121
-
122
-
123
-
124
-
125
-
126
-
127
-
128
-
129
-
130
-
131
-
132
-
133
-
134
-
135
-
136
-
137
-
138
-
139
-
140
-
141
-
142
-
143
-
144
-
145
-
146
-
147
-
148
-
149
-
150
-
151
-
152
-
153
-
154
-
155
-
156
-
157
-
158
-
159
-
160
-
161
-
162
-
163
-
164
-
165
-
 166
166 -
 167
167 -
 168
168 -
 169
169 -
 170
170 -
 171
171 -
 172
172 -
 173
173 -
 174
174 -
 175
175 -
 176
176 -
 177
177 -
 178
178 -
 179
179 -
 180
180 -
 181
181 -
 182
182 -
 183
183 -
 184
184 -
 185
185 -
 186
186 -
187
-
188
-
189
-
190
-
191
-
192
-
193
-
194
-
195
-
196
-
197
-
198
-
199
-
200
-
201
-
202
-
203
-
204
-
205
-
206
-
207
-
208
-
209
-
210
-
211
-
212
-
213
-
214
-
215
-
216
-
217
-
218
-
219
-
220
-
221
-
222
-
223
-
224
-
225
-
226
 |
 |

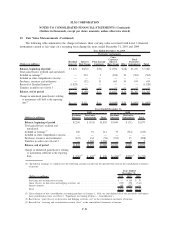
13. Stock-Based Compensation Plans and Arrangements (Continued)
Employee Stock Purchase Plan
Under the ESPP, employees can purchase shares of our common stock at the end of a 12-month offering
period at a price equal to the share price at the beginning of the 12-month period, less 15 percent, up to a
maximum purchase price of $7,500 plus accrued interest. The purchase price for each offering is determined
at the beginning of the offering period.
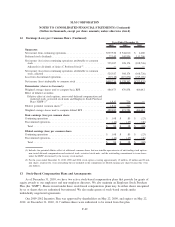
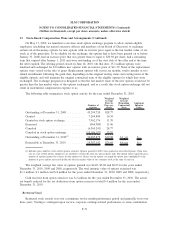
The fair values of the stock purchase rights of the ESPP offerings in the years ended December 31, 2010,
2009 and 2008 were calculated using a Black-Scholes option pricing model with the following weighted
average assumptions.
2010 2009 2008
Years Ended December 31,
Risk-free interest rate ...................................... .33% .53% 1.91%
Expected volatility ........................................ 61% 103% 58%
Expected dividend rate ..................................... 0.00% 0.00% 0.00%
Expected life of the option .................................. 1year 1 year 1 year
The expected volatility is based on implied volatility from publicly-traded options on our stock at the
grant date and historical volatility of our stock consistent with the expected life. The risk-free interest rate is
based on the U.S. Treasury spot rate at the grant date consistent with the expected life. The dividend yield is
based on the projected annual dividend payment per share based on the current dividend amount at the grant
date divided by the stock price at the grant date.
The weighted average fair value of the stock purchase rights of the ESPP offerings for the years ended
December 31, 2010, 2009 and 2008 was $3.30, $4.88 and $6.57, respectively. The fair values were amortized
to compensation cost on a straight-line basis over a one-year vesting period. As of December 31, 2010, there
was $.1 million of unrecognized compensation cost related to the ESPP, which is expected to be recognized in
January 2011.
During the year ended December 31, 2010, plan participants purchased 205,528 shares of our common
stock. No shares were purchased in 2008 or 2009.
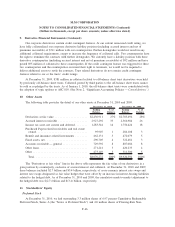
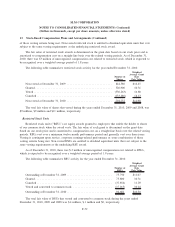
14. Restructuring Activities
Restructuring expenses of $91 million, $22 million and $84 million were recorded in the years ended
December 31, 2010, 2009 and 2008, respectively. Of these amounts, $85 million, $10 million and $72 million
was recognized in continuing operations and $6 million, $12 million and $12 million was recognized in
discontinued operations, respectively. The following details our restructuring efforts:
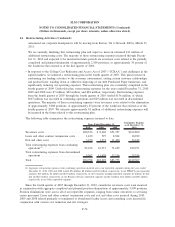
• On March 30, 2010, President Obama signed into law H.R. 4872, HCERA, which included the SAFRA
Act. Effective July 1, 2010, the legislation eliminated the authority to provide new loans under FFELP
and requires all new federal loans to be made through the DSLP. The new law did not alter or affect
the terms and conditions of existing FFELP Loans. We continue to restructure our operations in
response to this change in law which will result in a significant reduction of operating costs due to the
elimination of positions and facilities associated with the origination of FFELP Loans.
Restructuring expenses associated with this plan for the year ended December 31, 2010 were
$84 million, of which $83 million was recorded in continuing operations and $1 million was recorded
in discontinued operations. In connection with the HCERA restructuring effort, on July 1, 2010, we
F-73
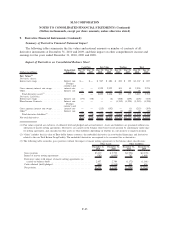
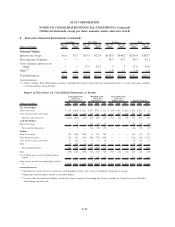
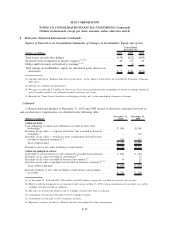
SLM CORPORATION
NOTES TO CONSOLIDATED FINANCIAL STATEMENTS (Continued)
(Dollars in thousands, except per share amounts, unless otherwise stated)