Sallie Mae 2010 Annual Report Download - page 197
Download and view the complete annual report
Please find page 197 of the 2010 Sallie Mae annual report below. You can navigate through the pages in the report by either clicking on the pages listed below, or by using the keyword search tool below to find specific information within the annual report.-
 1
1 -
2
-
3
-
4
-
5
-
6
-
7
-
8
-
9
-
10
-
11
-
12
-
13
-
14
-
15
-
16
-
17
-
18
-
19
-
20
-
21
-
22
-
23
-
24
-
25
-
26
-
27
-
28
-
29
-
30
-
31
-
32
-
33
-
34
-
35
-
36
-
37
-
38
-
39
-
40
-
41
-
42
-
43
-
44
-
45
-
46
-
47
-
48
-
49
-
50
-
51
-
52
-
53
-
54
-
55
-
56
-
57
-
58
-
59
-
60
-
61
-
62
-
63
-
64
-
65
-
66
-
67
-
68
-
69
-
70
-
71
-
72
-
73
-
74
-
75
-
76
-
77
-
78
-
79
-
80
-
81
-
82
-
83
-
84
-
85
-
86
-
87
-
88
-
89
-
90
-
91
-
92
-
93
-
94
-
95
-
96
-
97
-
98
-
99
-
100
-
101
-
102
-
103
-
104
-
105
-
106
-
107
-
108
-
109
-
110
-
111
-
112
-
113
-
114
-
115
-
116
-
117
-
118
-
119
-
120
-
121
-
122
-
123
-
124
-
125
-
126
-
127
-
128
-
129
-
130
-
131
-
132
-
133
-
134
-
135
-
136
-
137
-
138
-
139
-
140
-
141
-
142
-
143
-
144
-
145
-
146
-
147
-
148
-
149
-
150
-
151
-
152
-
153
-
154
-
155
-
156
-
157
-
158
-
159
-
160
-
161
-
162
-
163
-
164
-
165
-
166
-
167
-
168
-
169
-
170
-
171
-
172
-
173
-
174
-
175
-
176
-
177
-
178
-
179
-
180
-
181
-
182
-
183
-
184
-
185
-
186
-
 187
187 -
 188
188 -
 189
189 -
 190
190 -
 191
191 -
 192
192 -
 193
193 -
 194
194 -
 195
195 -
 196
196 -
 197
197 -
 198
198 -
 199
199 -
 200
200 -
 201
201 -
 202
202 -
 203
203 -
 204
204 -
 205
205 -
 206
206 -
 207
207 -
208
-
209
-
210
-
211
-
212
-
213
-
214
-
215
-
216
-
217
-
218
-
219
-
220
-
221
-
222
-
223
-
224
-
225
-
226
 |
 |
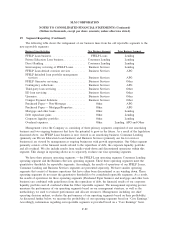
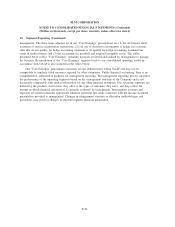
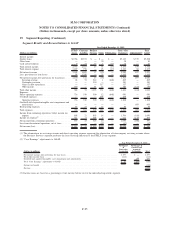
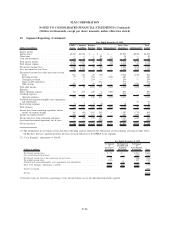
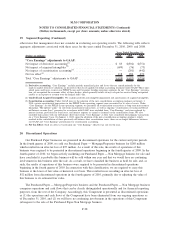
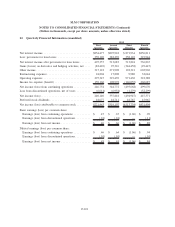
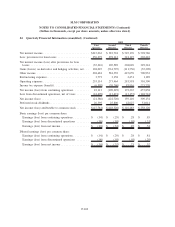
19. Segment Reporting (Continued)
management. The three items adjusted for in our “Core Earnings” presentations are (1) the off-balance sheet
treatment of certain securitization transactions, (2) our use of derivatives instruments to hedge our economic
risks that do not qualify for hedge accounting treatment or do qualify for hedge accounting treatment but
result in ineffectiveness and (3) the accounting for goodwill and acquired intangible assets. The tables
presented below reflect “Core Earnings” operating measures reviewed and utilized by management to manage
the business. Reconciliation of the “Core Earnings” segment totals to our consolidated operating results in
accordance with GAAP is also included in the tables below.
Our “Core Earnings” performance measures are not defined terms within GAAP and may not be
comparable to similarly titled measures reported by other companies. Unlike financial accounting, there is no
comprehensive, authoritative guidance for management reporting. The management reporting process measures
the performance of the operating segments based on the management structure of the Company and is not
necessarily comparable with similar information for any other financial institution. Our operating segments are
defined by the products and services they offer or the types of customers they serve, and they reflect the
manner in which financial information is currently evaluated by management. Intersegment revenues and
expenses are netted within the appropriate financial statement line items consistent with the income statement
presentation provided to management. Changes in management structure or allocation methodologies and
procedures may result in changes in reported segment financial information.
F-94
SLM CORPORATION
NOTES TO CONSOLIDATED FINANCIAL STATEMENTS (Continued)
(Dollars in thousands, except per share amounts, unless otherwise stated)