Sallie Mae 2010 Annual Report Download - page 167
Download and view the complete annual report
Please find page 167 of the 2010 Sallie Mae annual report below. You can navigate through the pages in the report by either clicking on the pages listed below, or by using the keyword search tool below to find specific information within the annual report.-
 1
1 -
2
-
3
-
4
-
5
-
6
-
7
-
8
-
9
-
10
-
11
-
12
-
13
-
14
-
15
-
16
-
17
-
18
-
19
-
20
-
21
-
22
-
23
-
24
-
25
-
26
-
27
-
28
-
29
-
30
-
31
-
32
-
33
-
34
-
35
-
36
-
37
-
38
-
39
-
40
-
41
-
42
-
43
-
44
-
45
-
46
-
47
-
48
-
49
-
50
-
51
-
52
-
53
-
54
-
55
-
56
-
57
-
58
-
59
-
60
-
61
-
62
-
63
-
64
-
65
-
66
-
67
-
68
-
69
-
70
-
71
-
72
-
73
-
74
-
75
-
76
-
77
-
78
-
79
-
80
-
81
-
82
-
83
-
84
-
85
-
86
-
87
-
88
-
89
-
90
-
91
-
92
-
93
-
94
-
95
-
96
-
97
-
98
-
99
-
100
-
101
-
102
-
103
-
104
-
105
-
106
-
107
-
108
-
109
-
110
-
111
-
112
-
113
-
114
-
115
-
116
-
117
-
118
-
119
-
120
-
121
-
122
-
123
-
124
-
125
-
126
-
127
-
128
-
129
-
130
-
131
-
132
-
133
-
134
-
135
-
136
-
137
-
138
-
139
-
140
-
141
-
142
-
143
-
144
-
145
-
146
-
147
-
148
-
149
-
150
-
151
-
152
-
153
-
154
-
155
-
156
-
 157
157 -
 158
158 -
 159
159 -
 160
160 -
 161
161 -
 162
162 -
 163
163 -
 164
164 -
 165
165 -
 166
166 -
 167
167 -
 168
168 -
 169
169 -
 170
170 -
 171
171 -
 172
172 -
 173
173 -
 174
174 -
 175
175 -
 176
176 -
 177
177 -
178
-
179
-
180
-
181
-
182
-
183
-
184
-
185
-
186
-
187
-
188
-
189
-
190
-
191
-
192
-
193
-
194
-
195
-
196
-
197
-
198
-
199
-
200
-
201
-
202
-
203
-
204
-
205
-
206
-
207
-
208
-
209
-
210
-
211
-
212
-
213
-
214
-
215
-
216
-
217
-
218
-
219
-
220
-
221
-
222
-
223
-
224
-
225
-
226
 |
 |

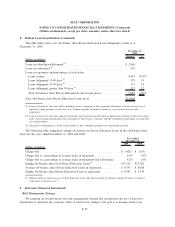
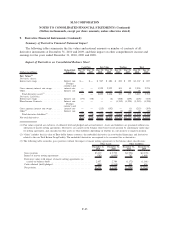
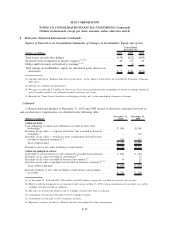
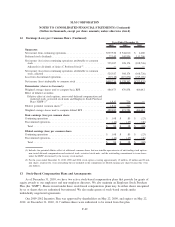
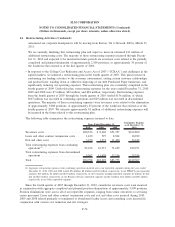
9. Derivative Financial Instruments (Continued)
(Dollars in billions)
Dec. 31,
2010
Dec. 31,
2009
Dec. 31,
2010
Dec. 31,
2009
Dec. 31,
2010
Dec. 31,
2009
Dec. 31,
2010
Dec. 31,
2009
Cash Flow Fair Value Trading Total
Notional Values:
Interest rate swaps .......... $1.6 $1.7 $13.5 $12.4 $118.9 $148.2 $134.0 $162.3
Floor Income Contracts ....... — — — — 39.3 47.1 39.3 47.1
Cross currency interest rate
swaps .................. — — 17.5 19.3 .3 .3 17.8 19.6
Other
(1)
................... — — — — 1.0 1.1 1.0 1.1
Total derivatives ............ $1.6 $1.7 $31.0 $31.7 $159.5 $196.7 $192.1 $230.1
(1) “Other” includes Euro-dollar futures contracts, embedded derivatives bifurcated from securitization debt, as well as derivatives related
to our Total Return Swap Facility.
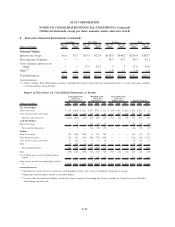
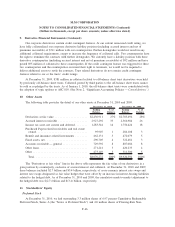
Impact of Derivatives on Consolidated Statements of Income
(Dollars in millions) 2010 2009 2008 2010 2009 2008 2010 2009 2008 2010 2009 2008
Unrealized Gain
(Loss) on
Derivatives
(1)(2)
Realized Gain
(Loss) on
Derivatives
(3)
Unrealized Gain
(Loss) on
Hedged Item
(1)
Total Gain (Loss)
Fair Value Hedges:
Interest rate swaps . .................... $ 289 $(801) $ 1,427 $ 487 $ 403 $ 157 $ (334) $ 850 $(1,532) $ 442 $ 452 $ 52
Cross currency interest rate swaps . .......... (1,871) 692 (1,537) 348 440 67 1,732 (934) 1,864 209 198 394
Total fair value derivatives .............. (1,582) (109) (110) 835 843 224 1,398 (84) 332 651 650 446
Cash Flow Hedges:
Interest rate swaps . .................... — 2 — (58) (75) (37) — — — (58) (73) (37)
Total cash flow derivatives .............. — 2 — (58) (75) (37) — — — (58) (73) (37)
Trading:
Interest rate swaps . .................... 412 (526) (261) 11 433 584 — — — 423 (93) 323
Floor Income Contracts . . . ............... 156 483 (529) (888) (717) (488) — — — (732) (234) (1,017)
Cross currency interest rate swaps . .......... 57 (26) 11 7 4 16 — — — 64 (22) 27
Other ............................ 37 (64) (3) 31 — 3 — — — 68 (64) —
Total trading derivatives . ............... 662 (133) (782) (839) (280) 115 — — — (177) (413) (667)
Total ............................. (920) (240) (892) (62) 488 302 1,398 (84) 332 416 164 (258)
Less: realized gains (losses) recorded in interest
expense . . ........................ — — — 777 768 187 — — — 777 768 187
Gains (losses) on derivative and hedging activities,
net............................. $ (920) $(240) $ (892) $(839) $(280) $ 115 $1,398 $ (84) $ 332 $(361) $(604) $ (445)
(1)
Recorded in “Gains (losses) on derivative and hedging activities, net” in the consolidated statements of income.
(2)
Represents ineffectiveness related to cash flow hedges.
(3)
For fair value and cash flow hedges, recorded in interest expense. For trading derivatives, recorded in “Gains (losses) on derivative
and hedging activities, net.”
F-64
SLM CORPORATION
NOTES TO CONSOLIDATED FINANCIAL STATEMENTS (Continued)
(Dollars in thousands, except per share amounts, unless otherwise stated)