Sallie Mae 2010 Annual Report Download - page 168
Download and view the complete annual report
Please find page 168 of the 2010 Sallie Mae annual report below. You can navigate through the pages in the report by either clicking on the pages listed below, or by using the keyword search tool below to find specific information within the annual report.-
 1
1 -
2
-
3
-
4
-
5
-
6
-
7
-
8
-
9
-
10
-
11
-
12
-
13
-
14
-
15
-
16
-
17
-
18
-
19
-
20
-
21
-
22
-
23
-
24
-
25
-
26
-
27
-
28
-
29
-
30
-
31
-
32
-
33
-
34
-
35
-
36
-
37
-
38
-
39
-
40
-
41
-
42
-
43
-
44
-
45
-
46
-
47
-
48
-
49
-
50
-
51
-
52
-
53
-
54
-
55
-
56
-
57
-
58
-
59
-
60
-
61
-
62
-
63
-
64
-
65
-
66
-
67
-
68
-
69
-
70
-
71
-
72
-
73
-
74
-
75
-
76
-
77
-
78
-
79
-
80
-
81
-
82
-
83
-
84
-
85
-
86
-
87
-
88
-
89
-
90
-
91
-
92
-
93
-
94
-
95
-
96
-
97
-
98
-
99
-
100
-
101
-
102
-
103
-
104
-
105
-
106
-
107
-
108
-
109
-
110
-
111
-
112
-
113
-
114
-
115
-
116
-
117
-
118
-
119
-
120
-
121
-
122
-
123
-
124
-
125
-
126
-
127
-
128
-
129
-
130
-
131
-
132
-
133
-
134
-
135
-
136
-
137
-
138
-
139
-
140
-
141
-
142
-
143
-
144
-
145
-
146
-
147
-
148
-
149
-
150
-
151
-
152
-
153
-
154
-
155
-
156
-
157
-
 158
158 -
 159
159 -
 160
160 -
 161
161 -
 162
162 -
 163
163 -
 164
164 -
 165
165 -
 166
166 -
 167
167 -
 168
168 -
 169
169 -
 170
170 -
 171
171 -
 172
172 -
 173
173 -
 174
174 -
 175
175 -
 176
176 -
 177
177 -
 178
178 -
179
-
180
-
181
-
182
-
183
-
184
-
185
-
186
-
187
-
188
-
189
-
190
-
191
-
192
-
193
-
194
-
195
-
196
-
197
-
198
-
199
-
200
-
201
-
202
-
203
-
204
-
205
-
206
-
207
-
208
-
209
-
210
-
211
-
212
-
213
-
214
-
215
-
216
-
217
-
218
-
219
-
220
-
221
-
222
-
223
-
224
-
225
-
226
 |
 |

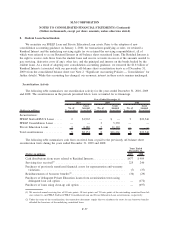
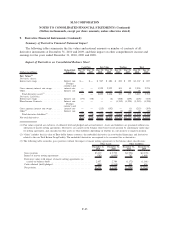
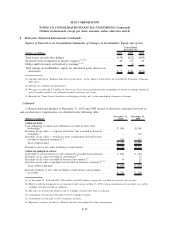
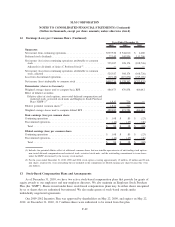
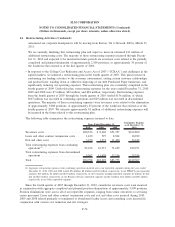
9. Derivative Financial Instruments (Continued)
Impact of Derivatives on Consolidated Statements of Changes in Stockholders’ Equity (net of tax)
(Dollars in millions) 2010 2009 2008
Years Ended
December 31,
Total losses on cash flow hedges ................................ $(35) $(22) $(95)
Realized losses recognized in interest expense
(1)(2)(3)
................. 40 63 24
Hedge ineffectiveness reclassified to earnings
(1)(4)
................... — (1) —
Total change in stockholders’ equity for unrealized gains (losses) on
derivatives ............................................... $ 5 $40 $(71)
(1) Amounts included in “Realized gain (loss) on derivatives” in the “Impact of Derivatives on Consolidated Statements of Income”
table above.
(2) Includes net settlement income/expense.
(3) We expect to reclassify $.1 million of after-tax net losses from accumulated other comprehensive income to earnings during the
next 12 months related to net settlement accruals on interest rate swaps.
(4) Recorded in “Gains (losses) derivatives and hedging activities, net” in the consolidated statements of income.
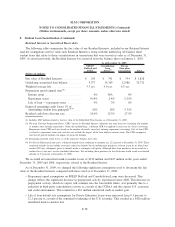
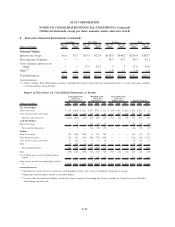
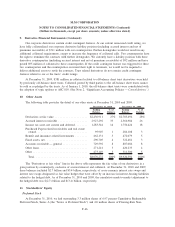
Collateral
Collateral held and pledged at December 31, 2010 and 2009 related to derivative exposures between us
and our derivative counterparties are detailed in the following table:
(Dollars in millions)
December 31,
2010
December 31,
2009
Collateral held:
Cash (obligation to return cash collateral is recorded in short-term
borrowings)
(1)
. . . . . . . . . . . . . . . . . . . . . . . . . . . . . . . . . . . . . . . . . . . . . . $ 886 $1,268
Securities at fair value — corporate derivatives (not recorded in financial
statements)
(2)
.............................................. — 112
Securities at fair value — on-balance sheet securitization derivatives (not
recorded in financial statements)
(3)
............................... 585 717
Total collateral held . . . . . . . . . . . . . . . . . . . . . . . . . . . . . . . . . . . . . . . . . . $1,471 $2,097
Derivative asset at fair value including accrued interest . . . . . . . . . . . . . . . . . . . $2,540 $3,119
Collateral pledged to others:
Cash (right to receive return of cash collateral is recorded in investments) . . . . . . $ 809 $ 636
Securities at fair value (recorded in investments)
(4)
...................... — 25
Securities at fair value (recorded in restricted investments)
(5)
............... 36 25
Securities at fair value re-pledged (not recorded in financial statements)
(5)(6)
.... — 87
Total collateral pledged . . . . . . . . . . . . . . . . . . . . . . . . . . . . . . . . . . . . . . . $ 845 $ 773
Derivative liability at fair value including accrued interest and premium
receivable . . . . . . . . . . . . . . . . . . . . . . . . . . . . . . . . . . . . . . . . . . . . . . . . . $ 747 $ 758
(1) At December 31, 2010 and 2009, $108 million and $447 million, respectively, was held in restricted cash accounts.
(2) Effective with the downgrade in our unsecured credit ratings on May 13, 2009, certain counterparties do not allow us to sell or
re-pledge securities it holds as collateral.
(3) The trusts do not have the ability to sell or re-pledge securities they hold as collateral.
(4) Counterparty does not have the right to sell or re-pledge securities.
(5) Counterparty has the right to sell or re-pledge securities.
(6) Represents securities we hold as collateral that have been pledged to other counterparties.
F-65
SLM CORPORATION
NOTES TO CONSOLIDATED FINANCIAL STATEMENTS (Continued)
(Dollars in thousands, except per share amounts, unless otherwise stated)