Sallie Mae 2010 Annual Report Download - page 7
Download and view the complete annual report
Please find page 7 of the 2010 Sallie Mae annual report below. You can navigate through the pages in the report by either clicking on the pages listed below, or by using the keyword search tool below to find specific information within the annual report.-
 1
1 -
 2
2 -
 3
3 -
 4
4 -
 5
5 -
 6
6 -
 7
7 -
 8
8 -
 9
9 -
 10
10 -
 11
11 -
 12
12 -
 13
13 -
 14
14 -
 15
15 -
 16
16 -
 17
17 -
 18
18 -
19
-
20
-
21
-
22
-
23
-
24
-
25
-
26
-
27
-
28
-
29
-
30
-
31
-
32
-
33
-
34
-
35
-
36
-
37
-
38
-
39
-
40
-
41
-
42
-
43
-
44
-
45
-
46
-
47
-
48
-
49
-
50
-
51
-
52
-
53
-
54
-
55
-
56
-
57
-
58
-
59
-
60
-
61
-
62
-
63
-
64
-
65
-
66
-
67
-
68
-
69
-
70
-
71
-
72
-
73
-
74
-
75
-
76
-
77
-
78
-
79
-
80
-
81
-
82
-
83
-
84
-
85
-
86
-
87
-
88
-
89
-
90
-
91
-
92
-
93
-
94
-
95
-
96
-
97
-
98
-
99
-
100
-
101
-
102
-
103
-
104
-
105
-
106
-
107
-
108
-
109
-
110
-
111
-
112
-
113
-
114
-
115
-
116
-
117
-
118
-
119
-
120
-
121
-
122
-
123
-
124
-
125
-
126
-
127
-
128
-
129
-
130
-
131
-
132
-
133
-
134
-
135
-
136
-
137
-
138
-
139
-
140
-
141
-
142
-
143
-
144
-
145
-
146
-
147
-
148
-
149
-
150
-
151
-
152
-
153
-
154
-
155
-
156
-
157
-
158
-
159
-
160
-
161
-
162
-
163
-
164
-
165
-
166
-
167
-
168
-
169
-
170
-
171
-
172
-
173
-
174
-
175
-
176
-
177
-
178
-
179
-
180
-
181
-
182
-
183
-
184
-
185
-
186
-
187
-
188
-
189
-
190
-
191
-
192
-
193
-
194
-
195
-
196
-
197
-
198
-
199
-
200
-
201
-
202
-
203
-
204
-
205
-
206
-
207
-
208
-
209
-
210
-
211
-
212
-
213
-
214
-
215
-
216
-
217
-
218
-
219
-
220
-
221
-
222
-
223
-
224
-
225
-
226
 |
 |
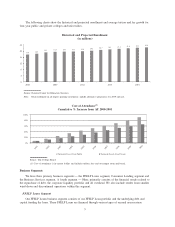
financing vehicles and unsecured debt. At December 31, 2010, we held $148.6 billion of FFELP Loans, of which
77 percent were funded to term by securitization trusts, 16 percent were funded through the ED Conduit Program
which terminates on January 19, 2014, and 5 percent were funded in our multi-year asset-backed commercial
paper (“ABCP”) facility and Federal Home Loan Bank in Des Moines facility (“FHLB-DM”). The remainder
was funded with unsecured debt. As a result of the long-term funding used in the FFELP Loan portfolio and the
government guarantees provided on the loans, the net interest margin recorded in the FFELP Loans segment
tends to be relatively stable. In addition to the net interest margin, we earn other fee income which is primarily
generated by late fees on the loans in the portfolio. For a more detailed description of these various funding
facilities, see Item 7 “Management’s Discussion and Analysis of Financial Condition and Results of
Operations — Liquidity and Capital Resources.”
FFELP Loans segment operating expenses primarily represent an intercompany charge from the Business
Services segment which performs the servicing of these loans. Servicing is charged at rates paid by the trusts
which own the loans. These servicing rates exceed the actual cost of servicing the loans.
Our FFELP Loan portfolio will amortize over approximately 25 years. Our goal is to maximize the cash
flow generated by the portfolio. We will seek to acquire third-party FFELP Loan portfolios to add spread
income and servicing revenue as portfolios are converted onto our platforms to generate incremental earnings
and cash flow. We expect owners of runoff portfolios to sell them in the future.
Consumer Lending Segment
In this segment, we originate, acquire, finance and service Private Education Loans. Private Education
Loans consist of two general types: (1) those that are designed to bridge the gap between the cost of higher
education and the amount financed through either federal loans or the borrowers’ resources, and (2) those that
are used to meet the needs of students in alternative learning programs such as career training, distance
learning and lifelong learning programs. Private Education Loans bear the full credit risk of the borrower. We
manage this risk by underwriting and pricing according to credit risk based upon customized credit scoring
criteria and the addition of qualified cosigners.
In 2010 we originated $2.3 billion of Private Education Loans. As of December 31, 2010 and 2009, we
had $35.7 billion and $35.1 billion of total “Core Earnings” basis Private Education Loans outstanding,
respectively. For a more detailed description of these amounts, see Item 7 “Management’s Discussion and
Analysis of Financial Condition and Results of Operations — Segment Earnings Summary — ‘Core Earnings’
Basis — Consumer Lending Segment.” At December 31, 2010, 68 percent of our Private Education Loans
were funded to term in securitization trusts and the remainder was funded with term unsecured debt and bank
deposits.
In this segment, we earn net interest income on the loan portfolio (after provision for loan losses) as well
as account fees, primarily late payment and forbearance fees. Operating expenses for this segment include
costs incurred to acquire and to service our loans.
In early 2011, we will launch a pilot Sallie Mae credit card that is tailored to meet the financial needs of
the college-educated consumer. We will market this card to college students and their parents and to customers
who have completed their education. We will focus on customers who have a strong credit profile. We have a
customer base of more than 20 million. Successfully cross-selling the Sallie Mae credit card could lead to an
expanded product mix on a stand-alone and partnership basis.
Sallie Mae Bank (“the Bank”), a Utah industrial bank subsidiary, plays an integral role in this segment.
We received our Utah State charter approval order effective October 12, 2005 and approval for our insurance
from the Federal Deposit Insurance Corporation (“FDIC”) on October 26, 2005. Since the beginning of 2006,
nearly all Private Education Loans have been originated and initially funded by the Bank. At December 31,
2010, the Bank had total assets of $7.6 billion including $4.4 billion in Private Education Loans and total
deposits of $5.9 billion. Historically, the Bank focused on raising brokered deposits with an average life in
excess of two years. In 2010 we began to gather retail deposits targeting our core customer base. We raised
more than $1 billion in retail deposits. We are now fully developing our banking products and services to offer
6