Sallie Mae 2010 Annual Report Download - page 50
Download and view the complete annual report
Please find page 50 of the 2010 Sallie Mae annual report below. You can navigate through the pages in the report by either clicking on the pages listed below, or by using the keyword search tool below to find specific information within the annual report.-
 1
1 -
2
-
3
-
4
-
5
-
6
-
7
-
8
-
9
-
10
-
11
-
12
-
13
-
14
-
15
-
16
-
17
-
18
-
19
-
20
-
21
-
22
-
23
-
24
-
25
-
26
-
27
-
28
-
29
-
30
-
31
-
32
-
33
-
34
-
35
-
36
-
37
-
38
-
39
-
 40
40 -
 41
41 -
 42
42 -
 43
43 -
 44
44 -
 45
45 -
 46
46 -
 47
47 -
 48
48 -
 49
49 -
 50
50 -
 51
51 -
 52
52 -
 53
53 -
 54
54 -
 55
55 -
 56
56 -
 57
57 -
 58
58 -
 59
59 -
 60
60 -
61
-
62
-
63
-
64
-
65
-
66
-
67
-
68
-
69
-
70
-
71
-
72
-
73
-
74
-
75
-
76
-
77
-
78
-
79
-
80
-
81
-
82
-
83
-
84
-
85
-
86
-
87
-
88
-
89
-
90
-
91
-
92
-
93
-
94
-
95
-
96
-
97
-
98
-
99
-
100
-
101
-
102
-
103
-
104
-
105
-
106
-
107
-
108
-
109
-
110
-
111
-
112
-
113
-
114
-
115
-
116
-
117
-
118
-
119
-
120
-
121
-
122
-
123
-
124
-
125
-
126
-
127
-
128
-
129
-
130
-
131
-
132
-
133
-
134
-
135
-
136
-
137
-
138
-
139
-
140
-
141
-
142
-
143
-
144
-
145
-
146
-
147
-
148
-
149
-
150
-
151
-
152
-
153
-
154
-
155
-
156
-
157
-
158
-
159
-
160
-
161
-
162
-
163
-
164
-
165
-
166
-
167
-
168
-
169
-
170
-
171
-
172
-
173
-
174
-
175
-
176
-
177
-
178
-
179
-
180
-
181
-
182
-
183
-
184
-
185
-
186
-
187
-
188
-
189
-
190
-
191
-
192
-
193
-
194
-
195
-
196
-
197
-
198
-
199
-
200
-
201
-
202
-
203
-
204
-
205
-
206
-
207
-
208
-
209
-
210
-
211
-
212
-
213
-
214
-
215
-
216
-
217
-
218
-
219
-
220
-
221
-
222
-
223
-
224
-
225
-
226
 |
 |
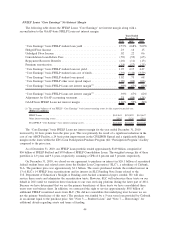
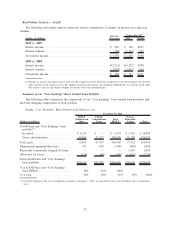
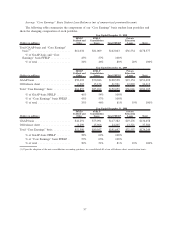
Education Loan allowance coverage of annual charge-offs ratio was 1.6 at December 31, 2010 compared with
1.5 at December 31, 2009. The allowance for loan losses as a percentage of ending Private Education Loans in
repayment decreased from 8.1 percent at December 31, 2009 to 7.3 percent at December 31, 2010. We
analyzed changes in the key ratios disclosed in the tables above when determining the appropriate Private
Education Loan allowance for loan losses.
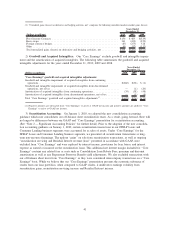
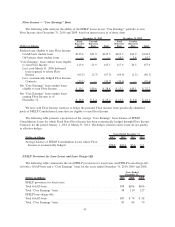
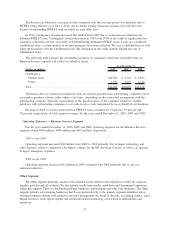
Servicing Revenue and Other Income — Consumer Lending Segment
Servicing revenue for our Consumer Lending segment primarily includes late fees and forbearance fees.
For the years ended December 31, 2010, 2009 and 2008, servicing revenue for our Consumer Lending segment
totaled $72 million, $70 million and $65 million, respectively.
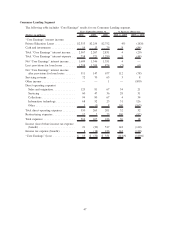
Operating Expenses — Consumer Lending Segment
Operating expenses for our Consumer Lending segment include costs incurred to originate Private
Education Loans and to service and collect on our “Core Earnings” basis Private Education Loan portfolio.
For the years ended December 31, 2010, 2009 and 2008, operating expenses for our Consumer Lending
segment totaled $350 million, $265 million and $201 million, respectively.
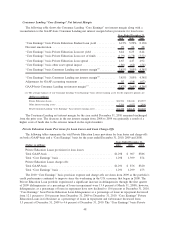
2010 versus 2009
Operating expenses increased $85 million from 2009, primarily as the result of a non-recurring $11 million
benefit in 2009 related to reversing a contingency reserve, an increase in collection and servicing costs from a
higher number of loans in repayment and delinquency status and higher marketing and technology enhance-
ment costs related to Private Education Loans in 2010. Operating expenses, excluding restructuring-related
asset impairments, were 96 basis points and 74 basis points, respectively, of average “Core Earnings” basis
Private Education Loans in the years ended December 31, 2010 and 2009.
2009 versus 2008
Operating expenses increased $64 million from 2008, primarily as a result of an increase in collection
and servicing costs from a higher number of loans in repayment and delinquency status and higher marketing
and technology enhancement costs related to Private Education Loans in 2009. Operating expenses, excluding
restructuring-related asset impairments, were 74 basis points and 61 basis points, respectively, of average
“Core Earnings” basis Private Education Loans in the years ended December 31, 2009 and 2008.
49