Sallie Mae 2010 Annual Report Download - page 47
Download and view the complete annual report
Please find page 47 of the 2010 Sallie Mae annual report below. You can navigate through the pages in the report by either clicking on the pages listed below, or by using the keyword search tool below to find specific information within the annual report.-
 1
1 -
2
-
3
-
4
-
5
-
6
-
7
-
8
-
9
-
10
-
11
-
12
-
13
-
14
-
15
-
16
-
17
-
18
-
19
-
20
-
21
-
22
-
23
-
24
-
25
-
26
-
27
-
28
-
29
-
30
-
31
-
32
-
33
-
34
-
35
-
36
-
 37
37 -
 38
38 -
 39
39 -
 40
40 -
 41
41 -
 42
42 -
 43
43 -
 44
44 -
 45
45 -
 46
46 -
 47
47 -
 48
48 -
 49
49 -
 50
50 -
 51
51 -
 52
52 -
 53
53 -
 54
54 -
 55
55 -
 56
56 -
 57
57 -
58
-
59
-
60
-
61
-
62
-
63
-
64
-
65
-
66
-
67
-
68
-
69
-
70
-
71
-
72
-
73
-
74
-
75
-
76
-
77
-
78
-
79
-
80
-
81
-
82
-
83
-
84
-
85
-
86
-
87
-
88
-
89
-
90
-
91
-
92
-
93
-
94
-
95
-
96
-
97
-
98
-
99
-
100
-
101
-
102
-
103
-
104
-
105
-
106
-
107
-
108
-
109
-
110
-
111
-
112
-
113
-
114
-
115
-
116
-
117
-
118
-
119
-
120
-
121
-
122
-
123
-
124
-
125
-
126
-
127
-
128
-
129
-
130
-
131
-
132
-
133
-
134
-
135
-
136
-
137
-
138
-
139
-
140
-
141
-
142
-
143
-
144
-
145
-
146
-
147
-
148
-
149
-
150
-
151
-
152
-
153
-
154
-
155
-
156
-
157
-
158
-
159
-
160
-
161
-
162
-
163
-
164
-
165
-
166
-
167
-
168
-
169
-
170
-
171
-
172
-
173
-
174
-
175
-
176
-
177
-
178
-
179
-
180
-
181
-
182
-
183
-
184
-
185
-
186
-
187
-
188
-
189
-
190
-
191
-
192
-
193
-
194
-
195
-
196
-
197
-
198
-
199
-
200
-
201
-
202
-
203
-
204
-
205
-
206
-
207
-
208
-
209
-
210
-
211
-
212
-
213
-
214
-
215
-
216
-
217
-
218
-
219
-
220
-
221
-
222
-
223
-
224
-
225
-
226
 |
 |

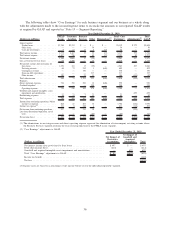
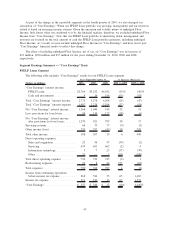
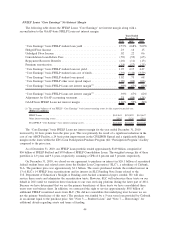
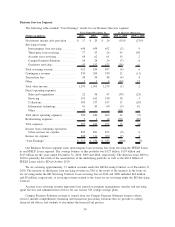
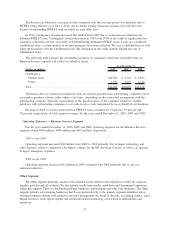
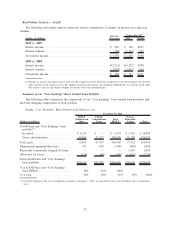
Servicing Revenue and Other Income — FFELP Loans Segment
The following table summarizes the components of “Core Earnings” other income for our FFELP Loans
segment for the years ended December 31, 2010, 2009, and 2008.
(Dollars in millions) 2010 2009 2008
Years Ended
December 31,
Servicing revenue ............................................ $ 68 $ 75 $77
Gains (losses) on sales of loans and securities, net .................... 325 284 (51)
Other...................................................... (5) 8 9
Total other income, net ........................................ $388 $367 $ 35
Servicing revenue for our FFELP Loans segment primarily consists of borrower late fees.
The gains on sales of loans and securities in the years ended December 31, 2010 and 2009, related
primarily to the sale of $20.4 billion and $18.5 billion loans, respectively, of FFELP Loans to ED as part of
the ED Purchase Program. The loss in 2008 primarily relates to the sale of approximately $1.0 billion of
FFELP Loans to the ED under ECASLA, which resulted in a $53 million loss.
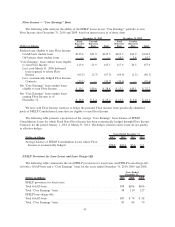
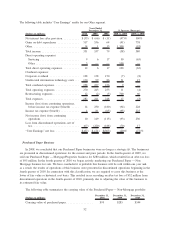
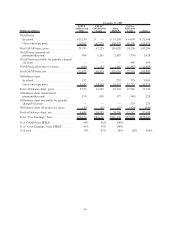
Operating Expenses — FFELP Loans Segment
Operating expenses for our FFELP Loans segment primarily include the contractual rates we are paid to
service loans in term asset-backed securitization trusts or a similar rate if a loan is not in a term financing
facility, the fees we pay for third party loan servicing and costs incurred to acquire loans. For the years ended
December 31, 2010, 2009 and 2008, operating expenses for our FFELP Loans segment totaled $736 million,
$754 million and $745 million, respectively. The intercompany revenue charged from the Business Services
segment and included in those amounts was $648 million, $659 million and $632 million for the years ended
December 31, 2010, 2009 and 2008, respectively. These amounts exceed the actual cost of servicing the loans.
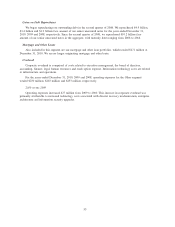
2010 versus 2009
Operating expenses decreased $18 million from the prior year, primarily due to the effect of our cost
cutting initiative in connection with the passage of HCERA. This was partially offset by a one-time fee paid to
acquire the SLC portfolio, an increase in legal contingency expenses and costs related to closing and selling
two loan originations centers in 2010. Operating expenses, excluding restructuring-related asset impairments,
were 51 basis points and 50 basis points of average “Core Earnings” basis FFELP Loans in the years ended
December 31, 2010 and 2009, respectively.
2009 versus 2008
Operating expenses for the year ended December 31, 2009, increased $9 million from the prior year
primarily due to an increase in our servicing expense as a result of an $8 billion increase in the average
balance of our FFELP Loan portfolio.
46