Sallie Mae 2010 Annual Report Download - page 72
Download and view the complete annual report
Please find page 72 of the 2010 Sallie Mae annual report below. You can navigate through the pages in the report by either clicking on the pages listed below, or by using the keyword search tool below to find specific information within the annual report.-
 1
1 -
2
-
3
-
4
-
5
-
6
-
7
-
8
-
9
-
10
-
11
-
12
-
13
-
14
-
15
-
16
-
17
-
18
-
19
-
20
-
21
-
22
-
23
-
24
-
25
-
26
-
27
-
28
-
29
-
30
-
31
-
32
-
33
-
34
-
35
-
36
-
37
-
38
-
39
-
40
-
41
-
42
-
43
-
44
-
45
-
46
-
47
-
48
-
49
-
50
-
51
-
52
-
53
-
54
-
55
-
56
-
57
-
58
-
59
-
60
-
61
-
 62
62 -
 63
63 -
 64
64 -
 65
65 -
 66
66 -
 67
67 -
 68
68 -
 69
69 -
 70
70 -
 71
71 -
 72
72 -
 73
73 -
 74
74 -
 75
75 -
 76
76 -
 77
77 -
 78
78 -
 79
79 -
 80
80 -
 81
81 -
 82
82 -
83
-
84
-
85
-
86
-
87
-
88
-
89
-
90
-
91
-
92
-
93
-
94
-
95
-
96
-
97
-
98
-
99
-
100
-
101
-
102
-
103
-
104
-
105
-
106
-
107
-
108
-
109
-
110
-
111
-
112
-
113
-
114
-
115
-
116
-
117
-
118
-
119
-
120
-
121
-
122
-
123
-
124
-
125
-
126
-
127
-
128
-
129
-
130
-
131
-
132
-
133
-
134
-
135
-
136
-
137
-
138
-
139
-
140
-
141
-
142
-
143
-
144
-
145
-
146
-
147
-
148
-
149
-
150
-
151
-
152
-
153
-
154
-
155
-
156
-
157
-
158
-
159
-
160
-
161
-
162
-
163
-
164
-
165
-
166
-
167
-
168
-
169
-
170
-
171
-
172
-
173
-
174
-
175
-
176
-
177
-
178
-
179
-
180
-
181
-
182
-
183
-
184
-
185
-
186
-
187
-
188
-
189
-
190
-
191
-
192
-
193
-
194
-
195
-
196
-
197
-
198
-
199
-
200
-
201
-
202
-
203
-
204
-
205
-
206
-
207
-
208
-
209
-
210
-
211
-
212
-
213
-
214
-
215
-
216
-
217
-
218
-
219
-
220
-
221
-
222
-
223
-
224
-
225
-
226
 |
 |

will enter repayment status as current and is expected to begin making their scheduled monthly payments on a
go-forward basis.
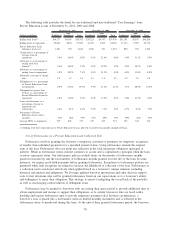
Forbearance may also be granted to borrowers who are delinquent in their payments. In these
circumstances, the forbearance cures the delinquency and the borrower is returned to a current repayment
status. In more limited instances, delinquent borrowers will also be granted additional forbearance time. As we
have obtained further experience about the effectiveness of forbearance, we have reduced the amount of time a
loan will spend in forbearance, thereby increasing our ongoing contact with the borrower to encourage
consistent repayment behavior once the loan is returned to a current repayment status. As a result, the balance
of loans in a forbearance status as of month-end has decreased since 2008. In addition, the monthly average
number of loans granted forbearance as a percentage of loans in repayment and forbearance declined to
5.3 percent in the fourth quarter of 2010 compared with the year-ago quarter of 5.6 percent. As of
December 31, 2010, 2.4 percent of loans in current status were delinquent as of the end of the prior month,
but were granted a forbearance that made them current as of December 31, 2010 (borrowers made payments
on approximately 20 percent of these loans prior to being granted forbearance).
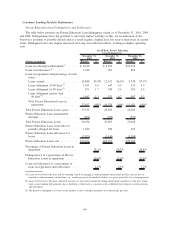
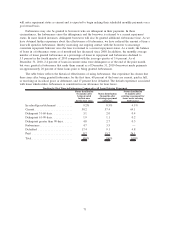
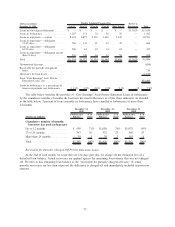
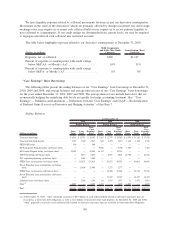
The table below reflects the historical effectiveness of using forbearance. Our experience has shown that
three years after being granted forbearance for the first time, 68 percent of the loans are current, paid in full,
or receiving an in-school grace or deferment, and 17 percent have defaulted. The default experience associated
with loans which utilize forbearance is considered in our allowance for loan losses.
Status distribution
36 months after
being granted
forbearance
for the first time
Status distribution
36 months after
entering repayment
(all loans)
Status distribution
36 months after
entering repayment for
loans never entering
forbearance
Tracking by First Time in Forbearance Compared to All Loans Entering Repayment
In-school/grace/deferment .......... 9.2% 8.5% 4.1%
Current ........................ 50.2 57.4 64.1
Delinquent 31-60 days ............. 3.1 2.0 0.4
Delinquent 61-90 days ............. 1.9 1.1 0.2
Delinquent greater than 90 days ...... 4.8 2.7 0.3
Forbearance ..................... 4.7 3.5 —
Defaulted ...................... 17.4 9.1 4.8
Paid .......................... 8.7 15.7 26.1
Total .......................... 100% 100% 100%
71