Sallie Mae 2010 Annual Report Download - page 166
Download and view the complete annual report
Please find page 166 of the 2010 Sallie Mae annual report below. You can navigate through the pages in the report by either clicking on the pages listed below, or by using the keyword search tool below to find specific information within the annual report.-
 1
1 -
2
-
3
-
4
-
5
-
6
-
7
-
8
-
9
-
10
-
11
-
12
-
13
-
14
-
15
-
16
-
17
-
18
-
19
-
20
-
21
-
22
-
23
-
24
-
25
-
26
-
27
-
28
-
29
-
30
-
31
-
32
-
33
-
34
-
35
-
36
-
37
-
38
-
39
-
40
-
41
-
42
-
43
-
44
-
45
-
46
-
47
-
48
-
49
-
50
-
51
-
52
-
53
-
54
-
55
-
56
-
57
-
58
-
59
-
60
-
61
-
62
-
63
-
64
-
65
-
66
-
67
-
68
-
69
-
70
-
71
-
72
-
73
-
74
-
75
-
76
-
77
-
78
-
79
-
80
-
81
-
82
-
83
-
84
-
85
-
86
-
87
-
88
-
89
-
90
-
91
-
92
-
93
-
94
-
95
-
96
-
97
-
98
-
99
-
100
-
101
-
102
-
103
-
104
-
105
-
106
-
107
-
108
-
109
-
110
-
111
-
112
-
113
-
114
-
115
-
116
-
117
-
118
-
119
-
120
-
121
-
122
-
123
-
124
-
125
-
126
-
127
-
128
-
129
-
130
-
131
-
132
-
133
-
134
-
135
-
136
-
137
-
138
-
139
-
140
-
141
-
142
-
143
-
144
-
145
-
146
-
147
-
148
-
149
-
150
-
151
-
152
-
153
-
154
-
155
-
 156
156 -
 157
157 -
 158
158 -
 159
159 -
 160
160 -
 161
161 -
 162
162 -
 163
163 -
 164
164 -
 165
165 -
 166
166 -
 167
167 -
 168
168 -
 169
169 -
 170
170 -
 171
171 -
 172
172 -
 173
173 -
 174
174 -
 175
175 -
 176
176 -
177
-
178
-
179
-
180
-
181
-
182
-
183
-
184
-
185
-
186
-
187
-
188
-
189
-
190
-
191
-
192
-
193
-
194
-
195
-
196
-
197
-
198
-
199
-
200
-
201
-
202
-
203
-
204
-
205
-
206
-
207
-
208
-
209
-
210
-
211
-
212
-
213
-
214
-
215
-
216
-
217
-
218
-
219
-
220
-
221
-
222
-
223
-
224
-
225
-
226
 |
 |

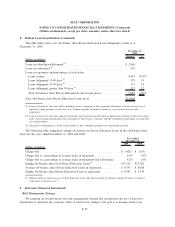
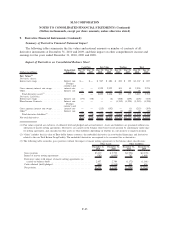
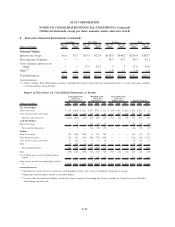
9. Derivative Financial Instruments (Continued)
Summary of Derivative Financial Statement Impact
The following tables summarize the fair values and notional amounts or number of contracts of all
derivative instruments at December 31, 2010 and 2009, and their impact on other comprehensive income and
earnings for the years ended December 31, 2010, 2009 and 2008.
Impact of Derivatives on Consolidated Balance Sheet
(Dollars in millions)
Hedged Risk
Exposure
Dec. 31,
2010
Dec. 31,
2009
Dec. 31,
2010
Dec. 31,
2009
Dec. 31,
2010
Dec. 31,
2009
Dec. 31,
2010
Dec. 31,
2009
Cash Flow Fair Value Trading Total
Fair Values
(1)
Derivative Assets:
Interest rate swaps ................. Interest rate $ — $ — $ 967 $ 684 $ 200 $ 133 $ 1,167 $ 817
Cross currency interest rate swaps .......
Foreign
currency and
interest rate — — 1,925 2,932 101 44 2,026 2,976
Other. . . ....................... Interest rate — — — — 26 — 26 —
Total derivative assets
(3)
............ — — 2,892 3,616 327 177 3,219 3,793
Derivative Liabilities:
Interest rate swaps ................. Interest rate (75) (78) — (6) (348) (639) (423) (723)
Floor Income Contracts . ............. Interest rate — — — — (1,315) (1,234) (1,315) (1,234)
Cross currency interest rate swaps .......
Foreign
currency and
interest rate — — (215) (192) — (1) (215) (193)
Other
(2)
........................ Interest rate — — — — (1) (20) (1) (20)
Total derivative liabilities
(3)
.......... (75) (78) (215) (198) (1,664) (1,894) (1,954) (2,170)
Net total derivatives . . . ............. $(75) $(78) $2,677 $3,418 $(1,337) $(1,717) $ 1,265 $ 1,623
(1) Fair values reported are exclusive of collateral held and pledged and accrued interest. Assets and liabilities are presented without con-
sideration of master netting agreements. Derivatives are carried on the balance sheet based on net position by counterparty under mas-
ter netting agreements, and classified in other assets or other liabilities depending on whether in a net positive or negative position.
(2) “Other” includes the fair value of Euro-dollar futures contracts, the embedded derivatives in asset-backed financings, and derivatives
related to the our Total Return Swap Facility. The embedded derivatives are required to be accounted for as derivatives.
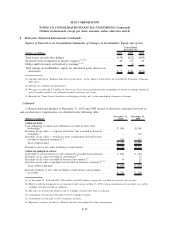
(3) The following table reconciles gross positions without the impact of master netting agreements to the balance sheet classification:
December 31,
2010
December 31,
2009
December 31,
2010
December 31,
2009
Other Assets Other Liabilities
Gross position . . .................................. $3,219 $ 3,793 $(1,954) $(2,170)
Impact of master netting agreements . . . ................... (782) (1,009) 782 1,009
Derivative values with impact of master netting agreements (as
carried on balance sheet) ............................ 2,437 2,784 (1,172) (1,161)
Cash collateral (held) pledged . . ........................ (886) (1,268) 809 636
Net position ...................................... $1,551 $ 1,516 $ (363) $ (525)
F-63
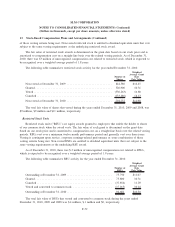
SLM CORPORATION
NOTES TO CONSOLIDATED FINANCIAL STATEMENTS (Continued)
(Dollars in thousands, except per share amounts, unless otherwise stated)