Sallie Mae 2006 Annual Report Download - page 99
Download and view the complete annual report
Please find page 99 of the 2006 Sallie Mae annual report below. You can navigate through the pages in the report by either clicking on the pages listed below, or by using the keyword search tool below to find specific information within the annual report.-
 1
1 -
2
-
3
-
4
-
5
-
6
-
7
-
8
-
9
-
10
-
11
-
12
-
13
-
14
-
15
-
16
-
17
-
18
-
19
-
20
-
21
-
22
-
23
-
24
-
25
-
26
-
27
-
28
-
29
-
30
-
31
-
32
-
33
-
34
-
35
-
36
-
37
-
38
-
39
-
40
-
41
-
42
-
43
-
44
-
45
-
46
-
47
-
48
-
49
-
50
-
51
-
52
-
53
-
54
-
55
-
56
-
57
-
58
-
59
-
60
-
61
-
62
-
63
-
64
-
65
-
66
-
67
-
68
-
69
-
70
-
71
-
72
-
73
-
74
-
75
-
76
-
77
-
78
-
79
-
80
-
81
-
82
-
83
-
84
-
85
-
86
-
87
-
88
-
 89
89 -
 90
90 -
 91
91 -
 92
92 -
 93
93 -
 94
94 -
 95
95 -
 96
96 -
 97
97 -
 98
98 -
 99
99 -
 100
100 -
 101
101 -
 102
102 -
 103
103 -
 104
104 -
 105
105 -
 106
106 -
 107
107 -
 108
108 -
 109
109 -
110
-
111
-
112
-
113
-
114
-
115
-
116
-
117
-
118
-
119
-
120
-
121
-
122
-
123
-
124
-
125
-
126
-
127
-
128
-
129
-
130
-
131
-
132
-
133
-
134
-
135
-
136
-
137
-
138
-
139
-
140
-
141
-
142
-
143
-
144
-
145
-
146
-
147
-
148
-
149
-
150
-
151
-
152
-
153
-
154
-
155
-
156
-
157
-
158
-
159
-
160
-
161
-
162
-
163
-
164
-
165
-
166
-
167
-
168
-
169
-
170
-
171
-
172
-
173
-
174
-
175
-
176
-
177
-
178
-
179
-
180
-
181
-
182
-
183
-
184
-
185
-
186
-
187
-
188
-
189
-
190
-
191
-
192
-
193
-
194
-
195
-
196
-
197
-
198
-
199
-
200
-
201
-
202
-
203
-
204
-
205
-
206
-
207
-
208
-
209
-
210
-
211
-
212
-
213
-
214
-
215
 |
 |

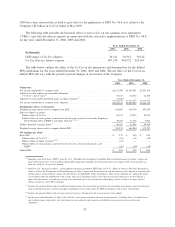
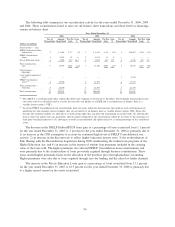
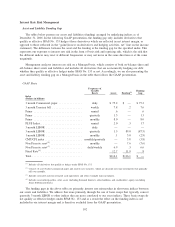
We receive annual servicing fees of 90 basis points, 50 basis points and 70 basis points of the outstanding
securitized loan balance related to our FFELP Stafford/PLUS, FFELP Consolidation Loan and Private
Education Loan securitizations, respectively.
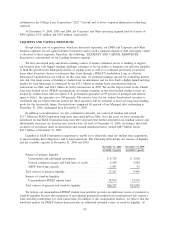
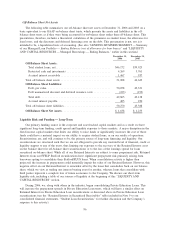
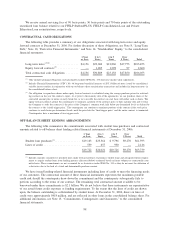
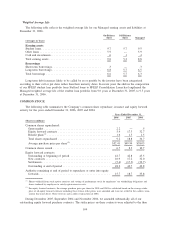
CONTRACTUAL CASH OBLIGATIONS
The following table provides a summary of our obligations associated with long-term notes and equity
forward contracts at December 31, 2006. For further discussion of these obligations, see Note 8, “Long-Term
Debt,” Note 10, “Derivative Financial Instruments,” and Note 14, “Stockholders’ Equity,” to the consolidated
financial statements.
1 Year
or Less
2to3
Years
4to5
Years
Over
5 Years Total
Long-term notes
(1)(2)
.................. $4,156 $29,684 $21,860 $47,753 $103,453
Equity forward contracts
(3)
............. — 1,205 1,298 97 2,600
Total contractual cash obligations ........ $4,156 $30,889 $23,158 $47,850 $106,053
(1)
Only includes principal obligations and specifically excludes SFAS No. 133 derivative market value adjustments.
(2)
Includes Financial Interpretation (“FIN”) No. 46 long-term beneficial interests of $55.1 billion of notes issued by consolidated
variable interest entities in conjunction with our on-balance sheet securitization transactions and included in long-term notes in
the consolidated balance sheet.
(3)
Our obligation to repurchase shares under equity forward contracts is calculated using the average purchase prices for outstand-
ing contracts in the year the contracts expire. At or prior to the maturity date of the agreements, we can purchase shares at the
contracted amount plus or minus an early break fee, or we can settle the contract on a net basis with either cash or shares. The
equity forward contracts permit the counterparty to terminate a portion of the contracts prior to their maturity date and to force
the Company to settle the contracts if the price of the Company’s common stock falls below pre-determined levels as defined by
the contract as the “initial trigger price.” The counterparty can continue to terminate portions of the contract if the stock price
continues to reach lower pre-determined levels, until the price hits the “final trigger price” and the entire contract is terminated.
Counterparties have a maximum of two triggers each.
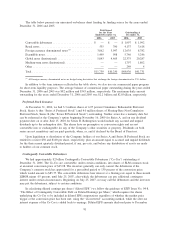
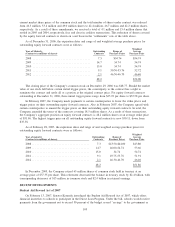
OFF-BALANCE SHEET LENDING ARRANGEMENTS
The following table summarizes the commitments associated with student loan purchases and contractual
amounts related to off-balance sheet lending related financial instruments at December 31, 2006.
1 Year
or Less
2to3
Years
4to5
Years
Over
5 Years Total
Student loan purchases
(1)
................ $19,163 $23,364 $ 9,796 $9,270 $61,593
Lines of credit ....................... 559 657 930 — 2,146
$19,722 $24,021 $10,726 $9,270 $63,739
(1)
Includes amounts committed at specified dates under forward contracts to purchase student loans and anticipated future require-
ments to acquire student loans from lending partners (discussed below) estimated based on future volumes at contractually com-
mitted rates. These commitments are not accounted for as derivatives under SFAS No. 133 as they do not meet the definition of
a derivative due to the lack of a fixed and determinable purchase amount.
We have issued lending-related financial instruments including lines of credit to meet the financing needs
of our customers. The contractual amount of these financial instruments represents the maximum possible
credit risk should the counterparty draw down the commitment and the counterparty subsequently fails to
perform according to the terms of our contract. The remaining total contractual amount available to be
borrowed under these commitments is $2.1 billion. We do not believe that these instruments are representative
of our actual future credit exposure or funding requirements. To the extent that the lines of credit are drawn
upon, the balance outstanding is collateralized by student loans. At December 31, 2006, draws on lines of
credit were approximately $418 million, and are reflected in other loans in the consolidated balance sheet. For
additional information, see Note 13, “Commitments, Contingencies and Guarantees,” to the consolidated
financial statements.
98