Sallie Mae 2006 Annual Report Download - page 163
Download and view the complete annual report
Please find page 163 of the 2006 Sallie Mae annual report below. You can navigate through the pages in the report by either clicking on the pages listed below, or by using the keyword search tool below to find specific information within the annual report.-
 1
1 -
2
-
3
-
4
-
5
-
6
-
7
-
8
-
9
-
10
-
11
-
12
-
13
-
14
-
15
-
16
-
17
-
18
-
19
-
20
-
21
-
22
-
23
-
24
-
25
-
26
-
27
-
28
-
29
-
30
-
31
-
32
-
33
-
34
-
35
-
36
-
37
-
38
-
39
-
40
-
41
-
42
-
43
-
44
-
45
-
46
-
47
-
48
-
49
-
50
-
51
-
52
-
53
-
54
-
55
-
56
-
57
-
58
-
59
-
60
-
61
-
62
-
63
-
64
-
65
-
66
-
67
-
68
-
69
-
70
-
71
-
72
-
73
-
74
-
75
-
76
-
77
-
78
-
79
-
80
-
81
-
82
-
83
-
84
-
85
-
86
-
87
-
88
-
89
-
90
-
91
-
92
-
93
-
94
-
95
-
96
-
97
-
98
-
99
-
100
-
101
-
102
-
103
-
104
-
105
-
106
-
107
-
108
-
109
-
110
-
111
-
112
-
113
-
114
-
115
-
116
-
117
-
118
-
119
-
120
-
121
-
122
-
123
-
124
-
125
-
126
-
127
-
128
-
129
-
130
-
131
-
132
-
133
-
134
-
135
-
136
-
137
-
138
-
139
-
140
-
141
-
142
-
143
-
144
-
145
-
146
-
147
-
148
-
149
-
150
-
151
-
152
-
 153
153 -
 154
154 -
 155
155 -
 156
156 -
 157
157 -
 158
158 -
 159
159 -
 160
160 -
 161
161 -
 162
162 -
 163
163 -
 164
164 -
 165
165 -
 166
166 -
 167
167 -
 168
168 -
 169
169 -
 170
170 -
 171
171 -
 172
172 -
 173
173 -
174
-
175
-
176
-
177
-
178
-
179
-
180
-
181
-
182
-
183
-
184
-
185
-
186
-
187
-
188
-
189
-
190
-
191
-
192
-
193
-
194
-
195
-
196
-
197
-
198
-
199
-
200
-
201
-
202
-
203
-
204
-
205
-
206
-
207
-
208
-
209
-
210
-
211
-
212
-
213
-
214
-
215
 |
 |

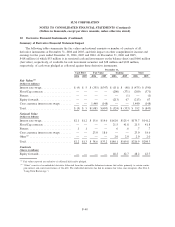
9. Student Loan Securitization (Continued)
(5)
In addition to the assumptions in the table above, the Company also projects the reduction in distributions that will result from the
various benefit programs that exist related to consecutive on-time payments by borrowers. Related to the entire $3.3 billion Residual
Interest there is $204 million (present value) of benefits projected which reduce the fair value.
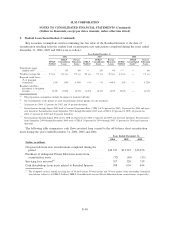
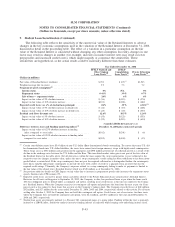
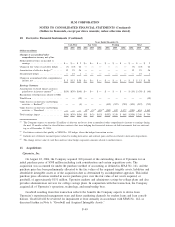
The table below shows the Company’s off-balance sheet Private Education Loan delinquency trends as of
December 31, 2006, 2005 and 2004.
Balance % Balance % Balance %
December 31,
2006
December 31,
2005
December 31,
2004
Off-Balance Sheet Private Education Loan Delinquencies
(Dollars in millions)
Loans in-school/grace/deferment
(1)
................ $ 5,608 $3,679 $2,622
Loans in forbearance
(2)
......................... 822 614 334
Loans in repayment and percentage of each status:
Loans current .............................. 6,419 94.5% 4,446 95.6% 3,191 95.2%
Loans delinquent 31-60 days
(3)
................. 222 3.3 136 2.9 84 2.5
Loans delinquent 61-90 days ................... 60 .9 35 .7 28 .8
Loans delinquent greater than 90 days ............ 91 1.3 36 .8 49 1.5
Total off-balance sheet Private Education Loans in
repayment ............................... 6,792 100% 4,653 100% 3,352 100%
Total off-balance sheet Private Education Loans,
gross .................................... $13,222 $8,946 $6,308
(1)
Loans for borrowers who still may be attending school or engaging in other permitted educational activities and are not yet
required to make payments on the loans, e.g., residency periods for medical students or a grace period for bar exam preparation.
(2)
Loans for borrowers who have requested extension of grace period generally during employment transition or who have tempo-
rarily ceased making full payments due to hardship or other factors, consistent with the established loan program servicing poli-
cies and procedures.
(3)
The period of delinquency is based on the number of days scheduled payments are contractually past due.
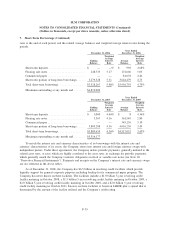
10. Derivative Financial Instruments
Risk Management Strategy
The Company maintains an overall interest rate risk management strategy that incorporates the use of
derivative instruments to minimize the economic effect of interest rate changes. The Company’s goal is to
manage interest rate sensitivity by modifying the repricing frequency and underlying index characteristics of
certain balance sheet assets and liabilities (including the Residual Interest from off-balance sheet securitiza-
tions) so that the net interest margin is not, on a material basis, adversely affected by movements in interest
rates. As a result of interest rate fluctuations, hedged assets and liabilities will appreciate or depreciate in
market value. Income or loss on the derivative instruments that are linked to the hedged assets and liabilities
will generally offset the effect of this unrealized appreciation or depreciation for the period the item is being
hedged. The Company views this strategy as a prudent management of interest rate sensitivity. In addition, the
Company utilizes derivative contracts to minimize the economic impact of changes in foreign currency
exchange rates on certain debt obligations that are denominated in foreign currencies. As foreign currency
exchange rates fluctuate, these liabilities will appreciate and depreciate in value. These fluctuations, to the
extent the hedge relationship is effective, are offset by changes in the value of the cross-currency interest rate
F-44
SLM CORPORATION
NOTES TO CONSOLIDATED FINANCIAL STATEMENTS (Continued)
(Dollars in thousands, except per share amounts, unless otherwise stated)