Sallie Mae 2006 Annual Report Download - page 103
Download and view the complete annual report
Please find page 103 of the 2006 Sallie Mae annual report below. You can navigate through the pages in the report by either clicking on the pages listed below, or by using the keyword search tool below to find specific information within the annual report.-
 1
1 -
2
-
3
-
4
-
5
-
6
-
7
-
8
-
9
-
10
-
11
-
12
-
13
-
14
-
15
-
16
-
17
-
18
-
19
-
20
-
21
-
22
-
23
-
24
-
25
-
26
-
27
-
28
-
29
-
30
-
31
-
32
-
33
-
34
-
35
-
36
-
37
-
38
-
39
-
40
-
41
-
42
-
43
-
44
-
45
-
46
-
47
-
48
-
49
-
50
-
51
-
52
-
53
-
54
-
55
-
56
-
57
-
58
-
59
-
60
-
61
-
62
-
63
-
64
-
65
-
66
-
67
-
68
-
69
-
70
-
71
-
72
-
73
-
74
-
75
-
76
-
77
-
78
-
79
-
80
-
81
-
82
-
83
-
84
-
85
-
86
-
87
-
88
-
89
-
90
-
91
-
92
-
 93
93 -
 94
94 -
 95
95 -
 96
96 -
 97
97 -
 98
98 -
 99
99 -
 100
100 -
 101
101 -
 102
102 -
 103
103 -
 104
104 -
 105
105 -
 106
106 -
 107
107 -
 108
108 -
 109
109 -
 110
110 -
 111
111 -
 112
112 -
 113
113 -
114
-
115
-
116
-
117
-
118
-
119
-
120
-
121
-
122
-
123
-
124
-
125
-
126
-
127
-
128
-
129
-
130
-
131
-
132
-
133
-
134
-
135
-
136
-
137
-
138
-
139
-
140
-
141
-
142
-
143
-
144
-
145
-
146
-
147
-
148
-
149
-
150
-
151
-
152
-
153
-
154
-
155
-
156
-
157
-
158
-
159
-
160
-
161
-
162
-
163
-
164
-
165
-
166
-
167
-
168
-
169
-
170
-
171
-
172
-
173
-
174
-
175
-
176
-
177
-
178
-
179
-
180
-
181
-
182
-
183
-
184
-
185
-
186
-
187
-
188
-
189
-
190
-
191
-
192
-
193
-
194
-
195
-
196
-
197
-
198
-
199
-
200
-
201
-
202
-
203
-
204
-
205
-
206
-
207
-
208
-
209
-
210
-
211
-
212
-
213
-
214
-
215
 |
 |

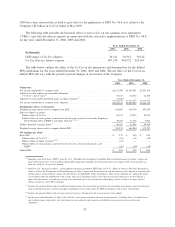
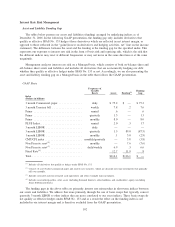
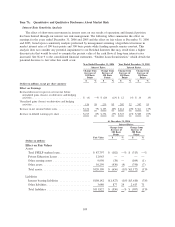
Interest Rate Risk Management
Asset and Liability Funding Gap
The tables below present our assets and liabilities (funding) arranged by underlying indices as of
December 31, 2006. In the following GAAP presentation, the funding gap only includes derivatives that
qualify as effective SFAS No. 133 hedges (those derivatives which are reflected in net interest margin, as
opposed to those reflected in the “gains/(losses) on derivatives and hedging activities, net” line on the income
statement). The difference between the asset and the funding is the funding gap for the specified index. This
represents our exposure to interest rate risk in the form of basis risk and repricing risk, which is the risk that
the different indices may reset at different frequencies or may not move in the same direction or at the same
magnitude.
Management analyzes interest rate risk on a Managed basis, which consists of both on-balance sheet and
off-balance sheet assets and liabilities and includes all derivatives that are economically hedging our debt
whether they qualify as effective hedges under SFAS No. 133 or not. Accordingly, we are also presenting the
asset and liability funding gap on a Managed basis in the table that follows the GAAP presentation.
GAAP Basis
Frequency of
Variable
Resets Assets Funding
(1)
Funding
Gap
Index
(Dollars in billions)
3 month Commercial paper ............... daily $ 75.2 $ — $ 75.2
3 month Treasury bill . .................. weekly 7.8 .2 7.6
Prime ............................... annual .6 — .6
Prime ............................... quarterly 1.3 — 1.3
Prime ............................... monthly 8.0 — 8.0
PLUS Index........................... annual 2.0 .3 1.7
3-month LIBOR ....................... daily — — —
3-month LIBOR ....................... quarterly 1.5 89.0 (87.5)
1-month LIBOR ....................... monthly .1 3.0 (2.9)
CMT/CPI index ........................ monthly/quarterly — 3.8 (3.8)
Non Discrete reset
(2)
.................... monthly — 7.6 (7.6)
Non Discrete reset
(3)
.................... daily/weekly 6.9 .3 6.6
Fixed Rate
(4)
.......................... 12.7 11.9 .8
Total ................................ $116.1 $116.1 $ —
(1)
Includes all derivatives that qualify as hedges under SFAS No. 133.
(2)
Consists of asset-backed commercial paper and auction rate securities, which are discount note type instruments that generally
roll over monthly.
(3)
Includes restricted and non-restricted cash equivalents and other overnight type instruments.
(4)
Includes receivables/payables, other assets (including Retained Interest), other liabilities and stockholders’ equity (excluding
Series B Preferred Stock).
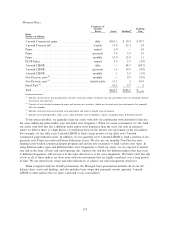
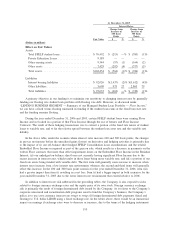
The funding gaps in the above table are primarily interest rate mismatches in short-term indices between
our assets and liabilities. We address this issue primarily through the use of basis swaps that typically convert
quarterly 3-month LIBOR to other indices that are more correlated to our asset indices. These basis swaps do
not qualify as effective hedges under SFAS No. 133 and as a result the effect on the funding index is not
included in our interest margin and is therefore excluded from the GAAP presentation.
102