Sallie Mae 2006 Annual Report Download - page 125
Download and view the complete annual report
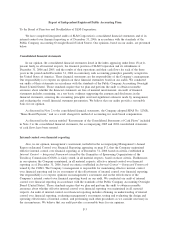
Please find page 125 of the 2006 Sallie Mae annual report below. You can navigate through the pages in the report by either clicking on the pages listed below, or by using the keyword search tool below to find specific information within the annual report.-
 1
1 -
2
-
3
-
4
-
5
-
6
-
7
-
8
-
9
-
10
-
11
-
12
-
13
-
14
-
15
-
16
-
17
-
18
-
19
-
20
-
21
-
22
-
23
-
24
-
25
-
26
-
27
-
28
-
29
-
30
-
31
-
32
-
33
-
34
-
35
-
36
-
37
-
38
-
39
-
40
-
41
-
42
-
43
-
44
-
45
-
46
-
47
-
48
-
49
-
50
-
51
-
52
-
53
-
54
-
55
-
56
-
57
-
58
-
59
-
60
-
61
-
62
-
63
-
64
-
65
-
66
-
67
-
68
-
69
-
70
-
71
-
72
-
73
-
74
-
75
-
76
-
77
-
78
-
79
-
80
-
81
-
82
-
83
-
84
-
85
-
86
-
87
-
88
-
89
-
90
-
91
-
92
-
93
-
94
-
95
-
96
-
97
-
98
-
99
-
100
-
101
-
102
-
103
-
104
-
105
-
106
-
107
-
108
-
109
-
110
-
111
-
112
-
113
-
114
-
 115
115 -
 116
116 -
 117
117 -
 118
118 -
 119
119 -
 120
120 -
 121
121 -
 122
122 -
 123
123 -
 124
124 -
 125
125 -
 126
126 -
 127
127 -
 128
128 -
 129
129 -
 130
130 -
 131
131 -
 132
132 -
 133
133 -
 134
134 -
 135
135 -
136
-
137
-
138
-
139
-
140
-
141
-
142
-
143
-
144
-
145
-
146
-
147
-
148
-
149
-
150
-
151
-
152
-
153
-
154
-
155
-
156
-
157
-
158
-
159
-
160
-
161
-
162
-
163
-
164
-
165
-
166
-
167
-
168
-
169
-
170
-
171
-
172
-
173
-
174
-
175
-
176
-
177
-
178
-
179
-
180
-
181
-
182
-
183
-
184
-
185
-
186
-
187
-
188
-
189
-
190
-
191
-
192
-
193
-
194
-
195
-
196
-
197
-
198
-
199
-
200
-
201
-
202
-
203
-
204
-
205
-
206
-
207
-
208
-
209
-
210
-
211
-
212
-
213
-
214
-
215
 |
 |

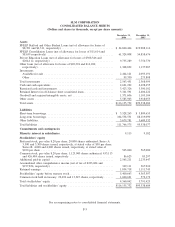
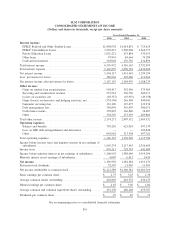
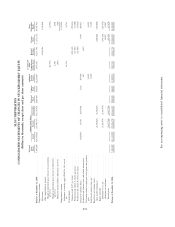
SLM CORPORATION
CONSOLIDATED STATEMENTS OF INCOME
(Dollars and shares in thousands, except per share amounts)
2006 2005 2004
Years Ended December 31,
Interest income:
FFELP Stafford and Other Student Loans .................. $1,408,938 $1,014,851 $ 725,619
FFELP Consolidation Loans ............................ 3,545,857 2,500,008 1,364,777
Private Education Loans ............................... 1,021,221 633,884 335,451
Other loans ......................................... 97,954 84,664 74,289
Cash and investments ................................. 503,002 276,756 232,859
Total interest income ................................... 6,576,972 4,510,163 2,732,995
Total interest expense ................................... 5,122,855 3,058,718 1,433,696
Net interest income .................................... 1,454,117 1,451,445 1,299,299
Less: provisions for losses ............................... 286,962 203,006 111,066
Net interest income after provisions for losses ................. 1,167,155 1,248,439 1,188,233
Other income:
Gains on student loan securitizations ...................... 902,417 552,546 375,384
Servicing and securitization revenue ...................... 553,541 356,730 560,971
Losses on securities, net ............................... (49,357) (63,955) (49,358)
Gains (losses) on derivative and hedging activities, net ......... (339,396) 246,548 849,041
Guarantor servicing fees ............................... 132,100 115,477 119,934
Debt management fees ................................ 396,830 359,907 300,071
Collections revenue ................................... 239,829 166,840 38,687
Other ............................................. 338,307 273,259 289,802
Total other income ..................................... 2,174,271 2,007,352 2,484,532
Operating expenses:
Salaries and benefits .................................. 703,210 625,024 497,170
Loss on GSE debt extinguishment and defeasance ............ — — 220,848
Other ............................................. 642,942 513,304 397,762
Total operating expenses ................................. 1,346,152 1,138,328 1,115,780
Income before income taxes and minority interest in net earnings of
subsidiaries ......................................... 1,995,274 2,117,463 2,556,985
Income taxes ......................................... 834,311 728,767 642,689
Income before minority interest in net earnings of subsidiaries . .... 1,160,963 1,388,696 1,914,296
Minority interest in net earnings of subsidiaries ................ 4,007 6,412 1,026
Net income .......................................... 1,156,956 1,382,284 1,913,270
Preferred stock dividends ................................ 35,567 21,903 11,501
Net income attributable to common stock .................... $1,121,389 $1,360,381 $1,901,769
Basic earnings per common share .......................... $ 2.73 $ 3.25 $ 4.36
Average common shares outstanding ........................ 410,805 418,374 436,133
Diluted earnings per common share......................... $ 2.63 $ 3.05 $ 4.04
Average common and common equivalent shares outstanding. . .... 451,170 460,260 475,787
Dividends per common share ............................. $ .97 $ .85 $ .74
See accompanying notes to consolidated financial statements.
F-6