Sallie Mae 2006 Annual Report Download - page 58
Download and view the complete annual report
Please find page 58 of the 2006 Sallie Mae annual report below. You can navigate through the pages in the report by either clicking on the pages listed below, or by using the keyword search tool below to find specific information within the annual report.-
 1
1 -
2
-
3
-
4
-
5
-
6
-
7
-
8
-
9
-
10
-
11
-
12
-
13
-
14
-
15
-
16
-
17
-
18
-
19
-
20
-
21
-
22
-
23
-
24
-
25
-
26
-
27
-
28
-
29
-
30
-
31
-
32
-
33
-
34
-
35
-
36
-
37
-
38
-
39
-
40
-
41
-
42
-
43
-
44
-
45
-
46
-
47
-
 48
48 -
 49
49 -
 50
50 -
 51
51 -
 52
52 -
 53
53 -
 54
54 -
 55
55 -
 56
56 -
 57
57 -
 58
58 -
 59
59 -
 60
60 -
 61
61 -
 62
62 -
 63
63 -
 64
64 -
 65
65 -
 66
66 -
 67
67 -
 68
68 -
69
-
70
-
71
-
72
-
73
-
74
-
75
-
76
-
77
-
78
-
79
-
80
-
81
-
82
-
83
-
84
-
85
-
86
-
87
-
88
-
89
-
90
-
91
-
92
-
93
-
94
-
95
-
96
-
97
-
98
-
99
-
100
-
101
-
102
-
103
-
104
-
105
-
106
-
107
-
108
-
109
-
110
-
111
-
112
-
113
-
114
-
115
-
116
-
117
-
118
-
119
-
120
-
121
-
122
-
123
-
124
-
125
-
126
-
127
-
128
-
129
-
130
-
131
-
132
-
133
-
134
-
135
-
136
-
137
-
138
-
139
-
140
-
141
-
142
-
143
-
144
-
145
-
146
-
147
-
148
-
149
-
150
-
151
-
152
-
153
-
154
-
155
-
156
-
157
-
158
-
159
-
160
-
161
-
162
-
163
-
164
-
165
-
166
-
167
-
168
-
169
-
170
-
171
-
172
-
173
-
174
-
175
-
176
-
177
-
178
-
179
-
180
-
181
-
182
-
183
-
184
-
185
-
186
-
187
-
188
-
189
-
190
-
191
-
192
-
193
-
194
-
195
-
196
-
197
-
198
-
199
-
200
-
201
-
202
-
203
-
204
-
205
-
206
-
207
-
208
-
209
-
210
-
211
-
212
-
213
-
214
-
215
 |
 |
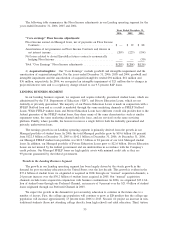
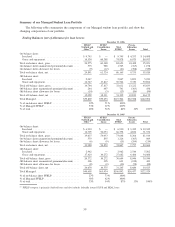
primarily originated through campus-based programs but during 2006, we aggressively grew our direct-to-con-
sumer Private Education Loans channel and expect it to be an increasing source of Private Education Loans in
the future. The Private Education Loan portfolio grew by 38 percent in 2006 to $22.6 billion and now
represents 16 percent of our Managed student loan portfolio, up from 13 percent in 2005.
Private Education Loans consist of two general types: (1) those that are designed to bridge the gap
between the cost of higher education and the amount financed through either capped federally insured loans or
the borrowers’ resources, and (2) those that are used to meet the needs of students in alternative learning
programs such as career training, distance learning and lifelong learning programs. Most higher education
Private Education Loans are made in conjunction with a FFELP Stafford loan and as such are marketed
through the same channel as FFELP loans by the same sales force. Unlike FFELP loans, Private Education
Loans are subject to the full credit risk of the borrower. We manage this additional risk through clearly-defined
loan underwriting standards and a combination of higher interest rates and loan origination fees that
compensate us for the higher risk. As a result, we earn higher spreads on Private Education Loans than on
FFELP loans. Private Education Loans will continue to be an important driver of future earnings growth as the
demand for post-secondary education grows and costs increase much faster than increases in federal loan
limits.
We originate lesser quantities of mortgage and consumer loans with the intent of immediately selling the
majority of the mortgage loans. Mortgage and consumer loan originations and the mortgage loan portfolio we
hold were 7 percent and less than one percent, respectively, of total loan originations and total loans
outstanding as of and for the year ended December 31, 2006.
57