Sallie Mae 2006 Annual Report Download - page 202
Download and view the complete annual report
Please find page 202 of the 2006 Sallie Mae annual report below. You can navigate through the pages in the report by either clicking on the pages listed below, or by using the keyword search tool below to find specific information within the annual report.-
 1
1 -
2
-
3
-
4
-
5
-
6
-
7
-
8
-
9
-
10
-
11
-
12
-
13
-
14
-
15
-
16
-
17
-
18
-
19
-
20
-
21
-
22
-
23
-
24
-
25
-
26
-
27
-
28
-
29
-
30
-
31
-
32
-
33
-
34
-
35
-
36
-
37
-
38
-
39
-
40
-
41
-
42
-
43
-
44
-
45
-
46
-
47
-
48
-
49
-
50
-
51
-
52
-
53
-
54
-
55
-
56
-
57
-
58
-
59
-
60
-
61
-
62
-
63
-
64
-
65
-
66
-
67
-
68
-
69
-
70
-
71
-
72
-
73
-
74
-
75
-
76
-
77
-
78
-
79
-
80
-
81
-
82
-
83
-
84
-
85
-
86
-
87
-
88
-
89
-
90
-
91
-
92
-
93
-
94
-
95
-
96
-
97
-
98
-
99
-
100
-
101
-
102
-
103
-
104
-
105
-
106
-
107
-
108
-
109
-
110
-
111
-
112
-
113
-
114
-
115
-
116
-
117
-
118
-
119
-
120
-
121
-
122
-
123
-
124
-
125
-
126
-
127
-
128
-
129
-
130
-
131
-
132
-
133
-
134
-
135
-
136
-
137
-
138
-
139
-
140
-
141
-
142
-
143
-
144
-
145
-
146
-
147
-
148
-
149
-
150
-
151
-
152
-
153
-
154
-
155
-
156
-
157
-
158
-
159
-
160
-
161
-
162
-
163
-
164
-
165
-
166
-
167
-
168
-
169
-
170
-
171
-
172
-
173
-
174
-
175
-
176
-
177
-
178
-
179
-
180
-
181
-
182
-
183
-
184
-
185
-
186
-
187
-
188
-
189
-
190
-
191
-
 192
192 -
 193
193 -
 194
194 -
 195
195 -
 196
196 -
 197
197 -
 198
198 -
 199
199 -
 200
200 -
 201
201 -
 202
202 -
 203
203 -
 204
204 -
 205
205 -
 206
206 -
 207
207 -
 208
208 -
 209
209 -
 210
210 -
 211
211 -
 212
212 -
213
-
214
-
215
 |
 |

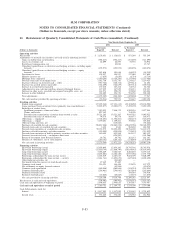
21. Restatement of Quarterly Consolidated Statements of Cash Flows (unaudited) (Continued)
(Dollars in thousands)
As Previously
Reported Restated
As Previously
Reported Restated
2006 2005
Nine Months Ended September 30,
Operating activities
Net income ............................................. $ 1,138,851 $ 1,138,851 $ 951,249 $ 951,249
Adjustments to reconcile net income to net cash used in operating activities:
Gains on student loan securitizations ............................ (902,417) (902,417) (311,895) (311,895)
Losses on securities, net ................................... 24,899 24,899 56,976 56,976
Stock-based compensation cost ............................... — 62,081 — 15,747
Unrealized (gains)/losses on derivative and hedging activities, excluding equity
forwards ............................................ (193,972) (193,972) (420,878) (420,878)
Unrealized (gains)/losses on derivative and hedging activities — equity
forwards ............................................ 181,616 181,616 (64,519) (64,519)
Provisions for losses ...................................... 194,957 194,957 137,688 137,688
Minority interest, net ..................................... (5,639) (5,639) (6,714) (6,714)
Mortgage loans originated .................................. (1,030,296) (1,030,296) (1,335,468) (1,335,468)
Proceeds from sales of mortgage loans .......................... 1,052,750 1,052,750 1,239,425 1,239,425
(Increase) decrease in restricted cash — other ...................... (587,724) (148,312) (279,814) 21,452
(Increase) in accrued interest receivable .......................... (722,659) (722,659) (469,714) (469,714)
Increase in accrued interest payable ............................ 167,418 167,418 82,764 82,764
Adjustment for non-cash (income)/loss related to Retained Interest ......... 147,839 147,839 194,231 194,231
Decrease in other assets, goodwill and acquired intangible assets, net ....... 144,974 390,679 153,860 346,664
Increase in other liabilities .................................. 332,889 394,756 594,256 592,188
Total adjustments ........................................ (1,195,365) (386,300) (429,802) 77,947
Net cash (used in) provided by operating activities ................... (56,514) 752,551 521,447 1,029,196
Investing activities
Student loans acquired .................................... (27,072,346) (27,121,113) (23,108,450) (23,166,508)
Loans purchased from securitized trusts (primarily loan consolidations) ...... (5,903,077) (5,903,077) (7,459,199) (7,459,199)
Reduction of student loans:
Installment payments, claims and other ......................... 7,019,033 7,846,175 4,909,516 5,677,844
Claims and resales ..................................... 827,142 — 768,328 —
Proceeds from securitization of student loans treated as sales ........... 19,521,365 19,521,365 9,045,932 9,045,932
Proceeds from sales of student loans .......................... 94,578 94,578 166,471 166,471
Other loans — originated ................................... (1,302,201) (1,302,201) (346,473) (346,473)
Other loans — repaid ..................................... 1,159,201 1,159,201 393,838 393,838
Other investing activities, net ................................ — (110,866) — (98,624)
Purchases of available-for-sale securities ......................... (58,867,668) (58,882,238) (50,629,556) (50,606,999)
Proceeds from sales of available-for-sale securities ................... 3,428 2,866 983,469 624,960
Proceeds from maturities of available-for-sale securities ................ 59,374,975 59,393,499 50,764,290 51,129,175
Purchases of held-to-maturity and other securities ................... (559,098) (559,098) (713,852) (713,852)
Proceeds from maturities of held-to-maturity securities and other securities .... 650,480 635,268 685,132 685,132
(Increase) in restricted cash — on-balance sheet trusts ................. — (424,200) — (301,266)
Return of investment from Retained Interest ....................... 66,781 66,781 161,183 161,183
Purchase of subsidiaries, net of cash acquired ...................... (289,162) (289,162) (178,844) (178,844)
Net cash used in investing activities ............................ (5,276,569) (5,872,222) (14,558,215) (14,987,230)
Financing activities
Short-term borrowings issued ................................ 15,858,049 15,854,385 56,745,936 56,745,936
Short-term borrowings repaid ................................ (15,860,749) (15,860,749) (56,834,645) (56,834,645)
Long-term borrowings issued ................................ 7,698,469 7,682,583 8,286,865 8,275,110
Long-term borrowings repaid ................................ (4,494,881) (4,284,140) (4,957,066) (1,391,778)
Borrowings collateralized by loans in trust issued .................... 6,203,019 6,203,019 9,808,399 9,808,399
Borrowings collateralized by loans in trust — activity ................. (3,631,741) (3,853,679) (627,003) (4,202,490)
Other financing activities, net ................................ — (64,886) — —
Tax benefit from the exercise of stock-based awards .................. 27,445 27,445 — —
Common stock issued ..................................... 216,321 144,448 173,878 157,572
Net settlements on equity forward contracts ....................... — (45,906) — (40,474)
Common stock repurchased ................................. (469,846) (469,846) (514,934) (514,934)
Common dividends paid ................................... (296,081) (296,081) (263,884) (263,884)
Preferred dividends issued .................................. — — 396,910 396,910
Preferred dividends paid ................................... (25,825) (25,825) (13,875) (13,875)
Net cash provided by financing activities ......................... 5,224,180 5,010,768 12,200,581 12,121,847
Net decrease in cash and cash equivalents .......................... (108,903) (108,903) (1,836,187) (1,836,187)
Cash and cash equivalents at beginning of period ..................... 2,498,655 2,498,655 3,395,487 3,395,487
Cash and cash equivalents at end of period ....................... $ 2,389,752 $ 2,389,752 $ 1,559,300 $ 1,559,300
Cash disbursements made for:
Interest .............................................. $ 3,117,085 $ 3,117,085 $ 1,701,632 $ 1,701,632
Income taxes .......................................... $ 574,220 $ 574,220 $ 234,962 $ 234,962
F-83
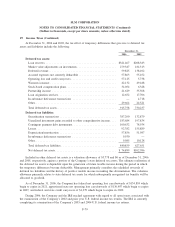
SLM CORPORATION
NOTES TO CONSOLIDATED FINANCIAL STATEMENTS (Continued)
(Dollars in thousands, except per share amounts, unless otherwise stated)