Sallie Mae 2006 Annual Report Download - page 78
Download and view the complete annual report
Please find page 78 of the 2006 Sallie Mae annual report below. You can navigate through the pages in the report by either clicking on the pages listed below, or by using the keyword search tool below to find specific information within the annual report.-
 1
1 -
2
-
3
-
4
-
5
-
6
-
7
-
8
-
9
-
10
-
11
-
12
-
13
-
14
-
15
-
16
-
17
-
18
-
19
-
20
-
21
-
22
-
23
-
24
-
25
-
26
-
27
-
28
-
29
-
30
-
31
-
32
-
33
-
34
-
35
-
36
-
37
-
38
-
39
-
40
-
41
-
42
-
43
-
44
-
45
-
46
-
47
-
48
-
49
-
50
-
51
-
52
-
53
-
54
-
55
-
56
-
57
-
58
-
59
-
60
-
61
-
62
-
63
-
64
-
65
-
66
-
67
-
 68
68 -
 69
69 -
 70
70 -
 71
71 -
 72
72 -
 73
73 -
 74
74 -
 75
75 -
 76
76 -
 77
77 -
 78
78 -
 79
79 -
 80
80 -
 81
81 -
 82
82 -
 83
83 -
 84
84 -
 85
85 -
 86
86 -
 87
87 -
 88
88 -
89
-
90
-
91
-
92
-
93
-
94
-
95
-
96
-
97
-
98
-
99
-
100
-
101
-
102
-
103
-
104
-
105
-
106
-
107
-
108
-
109
-
110
-
111
-
112
-
113
-
114
-
115
-
116
-
117
-
118
-
119
-
120
-
121
-
122
-
123
-
124
-
125
-
126
-
127
-
128
-
129
-
130
-
131
-
132
-
133
-
134
-
135
-
136
-
137
-
138
-
139
-
140
-
141
-
142
-
143
-
144
-
145
-
146
-
147
-
148
-
149
-
150
-
151
-
152
-
153
-
154
-
155
-
156
-
157
-
158
-
159
-
160
-
161
-
162
-
163
-
164
-
165
-
166
-
167
-
168
-
169
-
170
-
171
-
172
-
173
-
174
-
175
-
176
-
177
-
178
-
179
-
180
-
181
-
182
-
183
-
184
-
185
-
186
-
187
-
188
-
189
-
190
-
191
-
192
-
193
-
194
-
195
-
196
-
197
-
198
-
199
-
200
-
201
-
202
-
203
-
204
-
205
-
206
-
207
-
208
-
209
-
210
-
211
-
212
-
213
-
214
-
215
 |
 |

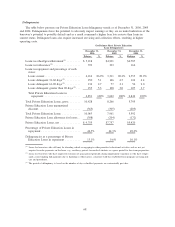
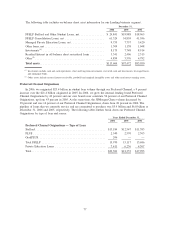
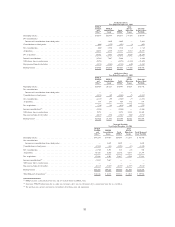
The following table includes on-balance sheet asset information for our Lending business segment.
2006 2005 2004
December 31,
FFELP Stafford and Other Student Loans, net................ $ 24,841 $19,988 $18,965
FFELP Consolidation Loans, net ......................... 61,324 54,859 41,596
Managed Private Education Loans, net ..................... 9,755 7,757 5,420
Other loans, net ...................................... 1,309 1,138 1,048
Investments
(1)
....................................... 8,175 7,748 8,914
Residual Interest in off-balance sheet securitized loans ......... 3,341 2,406 2,315
Other
(2)
............................................ 4,859 3,576 4,792
Total assets ......................................... $113,604 $97,472 $83,050
(1)
Investments include cash and cash equivalents, short and long-term investments, restricted cash and investments, leveraged leases,
and municipal bonds.
(2)
Other assets include accrued interest receivable, goodwill and acquired intangible assets and other non-interest earning assets.
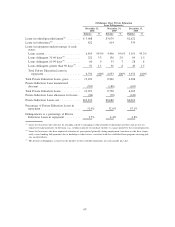
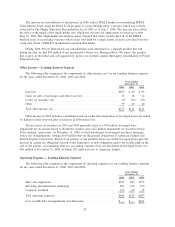
Preferred Channel Originations
In 2006, we originated $23.4 billion in student loan volume through our Preferred Channel, a 9 percent
increase over the $21.4 billion originated in 2005. In 2006, we grew the internal lending brand Preferred
Channel Originations by 43 percent and our own brands now constitute 56 percent of our Preferred Channel
Originations, up from 43 percent in 2005. At the same time, the JPMorgan Chase volume decreased by
38 percent and was 16 percent of our Preferred Channel Originations, down from 28 percent in 2004. The
pipeline of loans that we currently service and are committed to purchase was $5.4 billion and $6.8 billion at
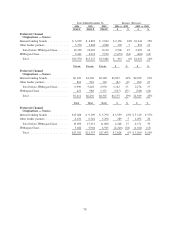
December 31, 2006 and 2005, respectively. The following tables further break down our Preferred Channel
Originations by type of loan and source.
2006 2005 2004
Years Ended December 31,
Preferred Channel Originations — Type of Loan
Stafford ............................................. $13,184 $12,547 $11,383
PLUS .............................................. 2,540 2,570 2,303
GradPLUS........................................... 246 — —
Total FFELP ......................................... 15,970 15,117 13,686
Private Education Loans ................................ 7,411 6,236 4,307
Total ............................................... $23,381 $21,353 $17,993
77