Sallie Mae 2006 Annual Report Download - page 13
Download and view the complete annual report
Please find page 13 of the 2006 Sallie Mae annual report below. You can navigate through the pages in the report by either clicking on the pages listed below, or by using the keyword search tool below to find specific information within the annual report.-
 1
1 -
2
-
 3
3 -
 4
4 -
 5
5 -
 6
6 -
 7
7 -
 8
8 -
 9
9 -
 10
10 -
 11
11 -
 12
12 -
 13
13 -
 14
14 -
 15
15 -
 16
16 -
 17
17 -
 18
18 -
 19
19 -
 20
20 -
 21
21 -
 22
22 -
 23
23 -
24
-
25
-
26
-
27
-
28
-
29
-
30
-
31
-
32
-
33
-
34
-
35
-
36
-
37
-
38
-
39
-
40
-
41
-
42
-
43
-
44
-
45
-
46
-
47
-
48
-
49
-
50
-
51
-
52
-
53
-
54
-
55
-
56
-
57
-
58
-
59
-
60
-
61
-
62
-
63
-
64
-
65
-
66
-
67
-
68
-
69
-
70
-
71
-
72
-
73
-
74
-
75
-
76
-
77
-
78
-
79
-
80
-
81
-
82
-
83
-
84
-
85
-
86
-
87
-
88
-
89
-
90
-
91
-
92
-
93
-
94
-
95
-
96
-
97
-
98
-
99
-
100
-
101
-
102
-
103
-
104
-
105
-
106
-
107
-
108
-
109
-
110
-
111
-
112
-
113
-
114
-
115
-
116
-
117
-
118
-
119
-
120
-
121
-
122
-
123
-
124
-
125
-
126
-
127
-
128
-
129
-
130
-
131
-
132
-
133
-
134
-
135
-
136
-
137
-
138
-
139
-
140
-
141
-
142
-
143
-
144
-
145
-
146
-
147
-
148
-
149
-
150
-
151
-
152
-
153
-
154
-
155
-
156
-
157
-
158
-
159
-
160
-
161
-
162
-
163
-
164
-
165
-
166
-
167
-
168
-
169
-
170
-
171
-
172
-
173
-
174
-
175
-
176
-
177
-
178
-
179
-
180
-
181
-
182
-
183
-
184
-
185
-
186
-
187
-
188
-
189
-
190
-
191
-
192
-
193
-
194
-
195
-
196
-
197
-
198
-
199
-
200
-
201
-
202
-
203
-
204
-
205
-
206
-
207
-
208
-
209
-
210
-
211
-
212
-
213
-
214
-
215
 |
 |
Sallie Mae’s Lending Business
Our primary marketing point-of-contact is the school’s financial aid office where we focus on delivering
flexible and cost-effective products to the school and its students. Our sales force, which works with financial
aid administrators on a daily basis, is the largest in the industry and currently markets the following internal
lender brands: Academic Management Services (“AMS”), Nellie Mae, Sallie Mae Educational Trust, SLM
Financial, Student Loan Funding Resources (“SLFR”), Southwest Student Services (“Southwest”) and Student
Loan Finance Association (“SLFA”). We also actively market the loan guarantee of United Student Aid Funds,
Inc. (“USA Funds”) and its affiliate, Northwest Education Loan Association (“NELA”), through a separate
sales force.
We acquire student loans from three principal sources:
• our Preferred Channel;
• FFELP Consolidation Loans; and
• strategic acquisitions.
Over the past several years, we have successfully changed our business model from a wholesale purchaser
of loans on the secondary market to a direct origination model where we control the front-end origination
process. This provides us with higher yielding loans with lower acquisition costs that have a longer duration
because we originate or purchase them at or immediately after full disbursement.
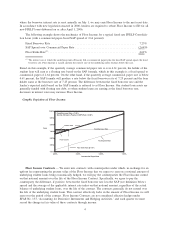
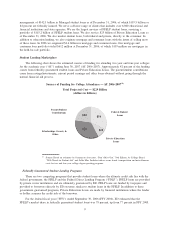
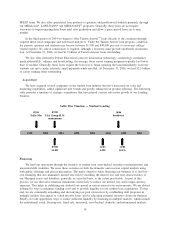
In 2006, we originated $23.4 billion in student loans through our Preferred Channel, of which a total of
$13.1 billion or 56 percent was originated through our internal lending brands. The mix of Preferred Channel
Originations marks a significant shift from the past, when our internal lending brands were the smallest
component of our Preferred Channel Originations. Internal lending brand growth is a key factor to our long-
term market penetration. In 2006, internal lending brands grew 43 percent to $13.1 billion. This positions us to
control our future volume as well as the costs to originate new assets. Our internal lending brand loans are our
most valuable loans because we do not pay a premium other than to ED to originate them. Our strategic lender
partners continue to represent an important loan acquisition channel for assets flowing through loan purchase
commitments as well as assets purchased in the retail secondary markets.
Our Preferred Channel Originations growth has been fueled by both new business from schools leaving
the FDLP or other FFELP lending relationships, same school sales growth, and growth in the for-profit sector.
Since 1999, we have partnered with over 300 schools that have chosen to return to the FFELP from the FDLP.
Our FFELP originations at these schools totaled over $2.1 billion in 2006. In addition to winning new schools,
we have also forged broader relationships with many of our existing school clients. Our FFELP and private
originations at for-profit schools have grown faster than at traditional higher education schools due to
enrollment trends as well as our increased market share of lending to these institutions.
Consolidation Loans
Over the past three years, we have seen a surge in consolidation activity as a result of aggressive
marketing and historically low interest rates. This growth has contributed to the changing composition of our
student loan portfolio. FFELP Consolidation Loans earn a lower yield than FFELP Stafford Loans due
primarily to the Consolidation Loan Rebate Fee. This negative impact is somewhat mitigated by the longer
average life of FFELP Consolidation Loans. We have made a substantial investment in consolidation marketing
to protect our asset base and grow our portfolio, including targeted direct mail campaigns and web-based
initiatives for borrowers. Weighing against this investment is a recent practice by which some FFELP lenders
use the Direct Lending program as a pass-through vehicle to circumvent the statutory prohibition on
refinancing an existing FFELP Consolidation Loan in cases where the borrower is not eligible to consolidate
his or her loans. This practice has since been prohibited under the student loan Reconciliation Legislation, but
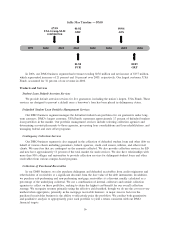
had a negative impact on our portfolio through the third quarter of 2006. In 2006, these developments resulted
in a net Managed portfolio loss of $3.1 billion from consolidation activity. During 2006, $15.8 billion of
FFELP Stafford loans in our Managed loan portfolio consolidated either with us ($11.3 billion) or with other
12