Sallie Mae 2006 Annual Report Download - page 190
Download and view the complete annual report
Please find page 190 of the 2006 Sallie Mae annual report below. You can navigate through the pages in the report by either clicking on the pages listed below, or by using the keyword search tool below to find specific information within the annual report.-
 1
1 -
2
-
3
-
4
-
5
-
6
-
7
-
8
-
9
-
10
-
11
-
12
-
13
-
14
-
15
-
16
-
17
-
18
-
19
-
20
-
21
-
22
-
23
-
24
-
25
-
26
-
27
-
28
-
29
-
30
-
31
-
32
-
33
-
34
-
35
-
36
-
37
-
38
-
39
-
40
-
41
-
42
-
43
-
44
-
45
-
46
-
47
-
48
-
49
-
50
-
51
-
52
-
53
-
54
-
55
-
56
-
57
-
58
-
59
-
60
-
61
-
62
-
63
-
64
-
65
-
66
-
67
-
68
-
69
-
70
-
71
-
72
-
73
-
74
-
75
-
76
-
77
-
78
-
79
-
80
-
81
-
82
-
83
-
84
-
85
-
86
-
87
-
88
-
89
-
90
-
91
-
92
-
93
-
94
-
95
-
96
-
97
-
98
-
99
-
100
-
101
-
102
-
103
-
104
-
105
-
106
-
107
-
108
-
109
-
110
-
111
-
112
-
113
-
114
-
115
-
116
-
117
-
118
-
119
-
120
-
121
-
122
-
123
-
124
-
125
-
126
-
127
-
128
-
129
-
130
-
131
-
132
-
133
-
134
-
135
-
136
-
137
-
138
-
139
-
140
-
141
-
142
-
143
-
144
-
145
-
146
-
147
-
148
-
149
-
150
-
151
-
152
-
153
-
154
-
155
-
156
-
157
-
158
-
159
-
160
-
161
-
162
-
163
-
164
-
165
-
166
-
167
-
168
-
169
-
170
-
171
-
172
-
173
-
174
-
175
-
176
-
177
-
178
-
179
-
 180
180 -
 181
181 -
 182
182 -
 183
183 -
 184
184 -
 185
185 -
 186
186 -
 187
187 -
 188
188 -
 189
189 -
 190
190 -
 191
191 -
 192
192 -
 193
193 -
 194
194 -
 195
195 -
 196
196 -
 197
197 -
 198
198 -
 199
199 -
 200
200 -
201
-
202
-
203
-
204
-
205
-
206
-
207
-
208
-
209
-
210
-
211
-
212
-
213
-
214
-
215
 |
 |
Plan has a match formula of up to 100 percent on the first 3 percent of contributions and 50 percent on the
next 2 percent of contributions after one year of service.
In conjunction with the 2006 acquisition of Upromise, the Company maintained the Upromise, Inc.
401(k) Plan. Eligible employees can contribute up to 60 percent of eligible compensation. For the 2006 plan
year, the Company provided matching contributions to eligible employees who were employed on the last day
of the plan year. Eligible employee contributions were matched by the Company $.50 for $1 up to a maximum
of $500.
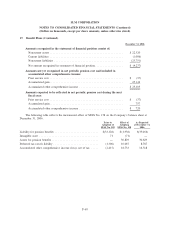
The Company also maintains a non-qualified plan to ensure that designated participants receive the full
amount of benefits to which they would have been entitled under the 401(k) Plan except for limits on
compensation imposed by the Internal Revenue Code.
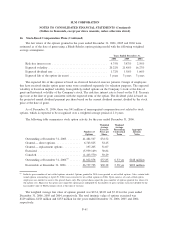
Total expenses related to the 401(k) plans were $21 million, $18 million and $19 million in 2006, 2005
and 2004, respectively.
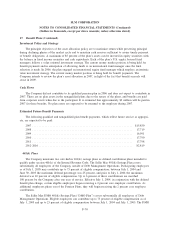
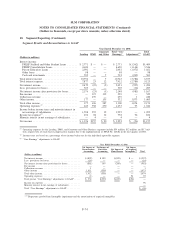
18. Segment Reporting
The Company has two primary operating segments as defined in SFAS No. 131, “Disclosures about
Segments of an Enterprise and Related Information” — the Lending and Debt Management Operations
(“DMO”) segments. The Lending and DMO operating segments meet the quantitative thresholds for reportable
segments identified in SFAS No. 131. Accordingly, the results of operations of the Company’s Lending and
DMO segments are presented below. The Company has smaller operating segments including the Guarantor
Servicing and Student Loan Servicing operating segments as well as certain other products and services
provided to colleges and universities which do not meet the quantitative thresholds identified in SFAS No. 131.
Therefore, the results of operations for these operating segments and the revenues and expenses associated
with these other products and services are combined with corporate overhead and other corporate activities
within the Corporate and Other reporting segment.
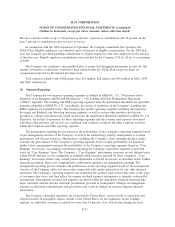
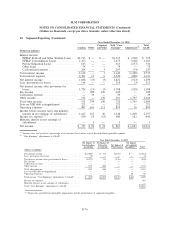
The management reporting process measures the performance of the Company’s operating segments based
on the management structure of the Company as well as the methodology used by management to evaluate
performance and allocate resources. Management, including the Company’s chief operating decision maker,
evaluates the performance of the Company’s operating segments based on their profitability. As discussed
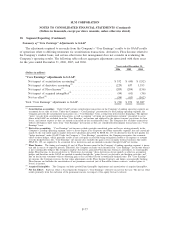
further below, management measures the profitability of the Company’s operating segments based on “Core
Earnings” net income. Accordingly, information regarding the Company’s reportable segments is provided
based on “Core Earnings” basis. The Company’s “Core Earnings” performance measures are not defined terms
within GAAP and may not be comparable to similarly titled measures reported by other companies. “Core
Earnings” net income reflects only current period adjustments to GAAP net income as described below. Unlike
financial accounting, there is no comprehensive, authoritative guidance for management reporting. The
management reporting process measures the performance of the operating segments based on the management
structure of the Company and is not necessarily comparable with similar information for any other financial
institution. The Company’s operating segments are defined by the products and services they offer or the types
of customers they serve, and they reflect the manner in which financial information is currently evaluated by
management. Intersegment revenues and expenses are netted within the appropriate financial statement line
items consistent with the income statement presentation provided to management. Changes in management
structure or allocation methodologies and procedures may result in changes in reported segment financial
information.
The Company’s principal operations are located in the United States, and its results of operations and
long-lived assets in geographic regions outside of the United States are not significant. In the Lending
segment, no individual customer accounted for more than 10 percent of its total revenue during the years
F-71
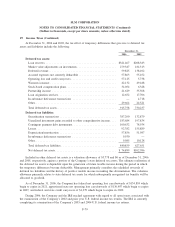
SLM CORPORATION
NOTES TO CONSOLIDATED FINANCIAL STATEMENTS (Continued)
(Dollars in thousands, except per share amounts, unless otherwise stated)