Sallie Mae 2006 Annual Report Download - page 56
Download and view the complete annual report
Please find page 56 of the 2006 Sallie Mae annual report below. You can navigate through the pages in the report by either clicking on the pages listed below, or by using the keyword search tool below to find specific information within the annual report.-
 1
1 -
2
-
3
-
4
-
5
-
6
-
7
-
8
-
9
-
10
-
11
-
12
-
13
-
14
-
15
-
16
-
17
-
18
-
19
-
20
-
21
-
22
-
23
-
24
-
25
-
26
-
27
-
28
-
29
-
30
-
31
-
32
-
33
-
34
-
35
-
36
-
37
-
38
-
39
-
40
-
41
-
42
-
43
-
44
-
45
-
 46
46 -
 47
47 -
 48
48 -
 49
49 -
 50
50 -
 51
51 -
 52
52 -
 53
53 -
 54
54 -
 55
55 -
 56
56 -
 57
57 -
 58
58 -
 59
59 -
 60
60 -
 61
61 -
 62
62 -
 63
63 -
 64
64 -
 65
65 -
 66
66 -
67
-
68
-
69
-
70
-
71
-
72
-
73
-
74
-
75
-
76
-
77
-
78
-
79
-
80
-
81
-
82
-
83
-
84
-
85
-
86
-
87
-
88
-
89
-
90
-
91
-
92
-
93
-
94
-
95
-
96
-
97
-
98
-
99
-
100
-
101
-
102
-
103
-
104
-
105
-
106
-
107
-
108
-
109
-
110
-
111
-
112
-
113
-
114
-
115
-
116
-
117
-
118
-
119
-
120
-
121
-
122
-
123
-
124
-
125
-
126
-
127
-
128
-
129
-
130
-
131
-
132
-
133
-
134
-
135
-
136
-
137
-
138
-
139
-
140
-
141
-
142
-
143
-
144
-
145
-
146
-
147
-
148
-
149
-
150
-
151
-
152
-
153
-
154
-
155
-
156
-
157
-
158
-
159
-
160
-
161
-
162
-
163
-
164
-
165
-
166
-
167
-
168
-
169
-
170
-
171
-
172
-
173
-
174
-
175
-
176
-
177
-
178
-
179
-
180
-
181
-
182
-
183
-
184
-
185
-
186
-
187
-
188
-
189
-
190
-
191
-
192
-
193
-
194
-
195
-
196
-
197
-
198
-
199
-
200
-
201
-
202
-
203
-
204
-
205
-
206
-
207
-
208
-
209
-
210
-
211
-
212
-
213
-
214
-
215
 |
 |

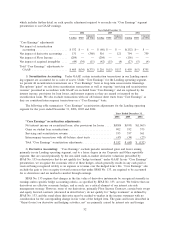
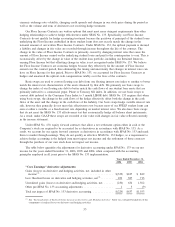
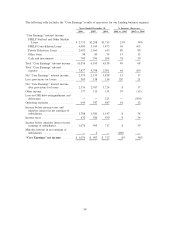
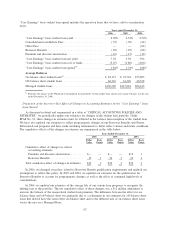
The following table summarizes the Floor Income adjustments in our Lending operating segment for the
years ended December 31, 2006, 2005 and 2004.
2006 2005 2004
Years Ended December 31,
“Core earnings” Floor Income adjustments:
Floor Income earned on Managed loans, net of payments on Floor Income
Contracts . . . ............................................ $ — $ 19 $ 88
Amortization of net premiums on Floor Income Contracts and futures in
net interest income ........................................ (209) (223) (194)
Net losses related to closed Eurodollar futures contracts economically
hedging Floor Income ..................................... — — (50)
Total “Core Earnings” Floor Income adjustments ................... $(209) $(204) $(156)
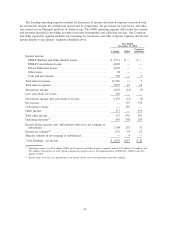
4) Acquired intangibles: Our “Core Earnings” exclude goodwill and intangible impairment and the
amortization of acquired intangibles. For the years ended December 31, 2006, 2005 and 2004, goodwill and
intangible impairment and the amortization of acquired intangibles totaled $94 million, $61 million and
$36 million, respectively. In 2006, we recognized an intangible impairment of $21 million due to changes in
projected interest rates and to a regulatory change related to our 9.5 percent SAP loans.
LENDING BUSINESS SEGMENT
In our Lending business segment, we originate and acquire federally guaranteed student loans, which are
administered by the U.S. Department of Education (“ED”), and Private Education Loans, which are not
federally or privately guaranteed. The majority of our Private Education Loans is made in conjunction with a
FFELP Stafford loan and as a result is marketed through the same marketing channels as FFELP Stafford
Loans. While FFELP student loans and Private Education Loans have different overall risk profiles due to the
federal guarantee of the FFELP student loans, they share many of the same characteristics such as similar
repayment terms, the same marketing channel and sales force, and are serviced on the same servicing
platform. Finally, where possible, the borrower receives a single bill for both the federally guaranteed and
privately underwritten loans.
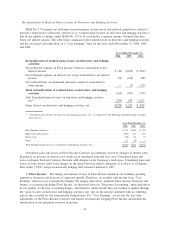
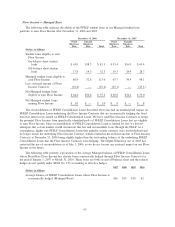
The earnings growth in our Lending operating segment is primarily derived from the growth in our
Managed portfolio of student loans. In 2006, the total Managed portfolio grew by $19.6 billion (16 percent)
from $122.5 billion at December 31, 2005 to $142.1 billion at December 31, 2006. At December 31, 2006,
our Managed FFELP student loan portfolio was $119.5 billion or 84 percent of our total Managed student
loans. In addition, our Managed portfolio of Private Education Loans grew to $22.6 billion. Private Education
Loans are not insured by the federal government and are underwritten in accordance with the Company’s
credit policies. Our Managed FFELP loans are high quality assets with minimal credit risk as they are
99 percent guaranteed by the federal government.
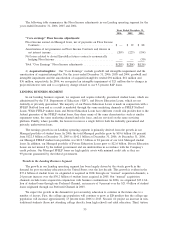
Trends in the Lending Business Segment
The growth in our Lending operating segment has been largely driven by the steady growth in the
demand for post-secondary education in the United States over the last decade. This growth is evident in the
$37.4 billion of student loans we originated or acquired in 2006 through our “normal” acquisition channels, a
24 percent increase over the $30.2 billion of student loans acquired in 2005. Our “normal” acquisition
channels exclude loans acquired in conjunction with business combinations. In 2006, we originated $23.4 bil-
lion of student loans through our Preferred Channel, an increase of 9 percent over the $21.4 billion of student
loans originated through our Preferred Channel in 2005.
We expect the growth in the demand for post-secondary education to continue in the future due to a
number of factors. First, the college age population will continue to grow as ED predicts that the college-age
population will increase approximately 13 percent from 2006 to 2015. Second, we project an increase in non-
traditional students (those not attending college directly from high school) and adult education. Third, tuition
55