Sallie Mae 2006 Annual Report Download - page 53
Download and view the complete annual report
Please find page 53 of the 2006 Sallie Mae annual report below. You can navigate through the pages in the report by either clicking on the pages listed below, or by using the keyword search tool below to find specific information within the annual report.-
 1
1 -
2
-
3
-
4
-
5
-
6
-
7
-
8
-
9
-
10
-
11
-
12
-
13
-
14
-
15
-
16
-
17
-
18
-
19
-
20
-
21
-
22
-
23
-
24
-
25
-
26
-
27
-
28
-
29
-
30
-
31
-
32
-
33
-
34
-
35
-
36
-
37
-
38
-
39
-
40
-
41
-
42
-
 43
43 -
 44
44 -
 45
45 -
 46
46 -
 47
47 -
 48
48 -
 49
49 -
 50
50 -
 51
51 -
 52
52 -
 53
53 -
 54
54 -
 55
55 -
 56
56 -
 57
57 -
 58
58 -
 59
59 -
 60
60 -
 61
61 -
 62
62 -
 63
63 -
64
-
65
-
66
-
67
-
68
-
69
-
70
-
71
-
72
-
73
-
74
-
75
-
76
-
77
-
78
-
79
-
80
-
81
-
82
-
83
-
84
-
85
-
86
-
87
-
88
-
89
-
90
-
91
-
92
-
93
-
94
-
95
-
96
-
97
-
98
-
99
-
100
-
101
-
102
-
103
-
104
-
105
-
106
-
107
-
108
-
109
-
110
-
111
-
112
-
113
-
114
-
115
-
116
-
117
-
118
-
119
-
120
-
121
-
122
-
123
-
124
-
125
-
126
-
127
-
128
-
129
-
130
-
131
-
132
-
133
-
134
-
135
-
136
-
137
-
138
-
139
-
140
-
141
-
142
-
143
-
144
-
145
-
146
-
147
-
148
-
149
-
150
-
151
-
152
-
153
-
154
-
155
-
156
-
157
-
158
-
159
-
160
-
161
-
162
-
163
-
164
-
165
-
166
-
167
-
168
-
169
-
170
-
171
-
172
-
173
-
174
-
175
-
176
-
177
-
178
-
179
-
180
-
181
-
182
-
183
-
184
-
185
-
186
-
187
-
188
-
189
-
190
-
191
-
192
-
193
-
194
-
195
-
196
-
197
-
198
-
199
-
200
-
201
-
202
-
203
-
204
-
205
-
206
-
207
-
208
-
209
-
210
-
211
-
212
-
213
-
214
-
215
 |
 |

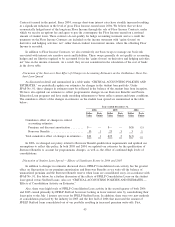
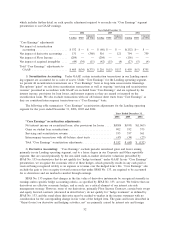
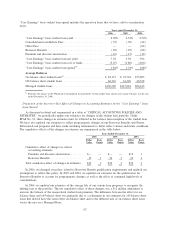
which includes further detail on each specific adjustment required to reconcile our “Core Earnings” segment
presentation to our GAAP earnings.
Lending DMO
Corporate
and Other Lending DMO
Corporate
and Other Lending DMO
Corporate
and Other
2006 2005 2004
Years Ended December 31,
“Core Earnings” adjustments:
Net impact of securitization
accounting .................... $532 $— $ — $ (60) $ — $ — $(152) $— $ —
Net impact of derivative accounting . . . 131 — (360) 516 — 121 794 — 759
Net impact of Floor Income ......... (209) — — (204) — — (156) — —
Net impact of acquired intangibles .... (49) (34) (11) (42) (15) (4) (27) (5) (4)
Total “Core Earnings” adjustments to
GAAP........................ $405 $(34) $(371) $ 210 $(15) $117 $ 459 $ (5) $755
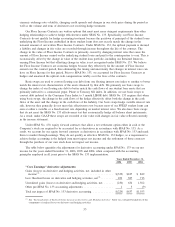
1) Securitization Accounting: Under GAAP, certain securitization transactions in our Lending operat-
ing segment are accounted for as sales of assets. Under “Core Earnings” for the Lending operating segment,
we present all securitization transactions on a “Core Earnings” basis as long-term non-recourse financings.
The upfront “gains” on sale from securitization transactions as well as ongoing “servicing and securitization
revenue” presented in accordance with GAAP are excluded from “Core Earnings” and are replaced by the
interest income, provisions for loan losses, and interest expense as they are earned or incurred on the
securitization loans. We also exclude transactions with our off-balance sheet trusts from “Core Earnings” as
they are considered intercompany transactions on a “Core Earnings” basis.
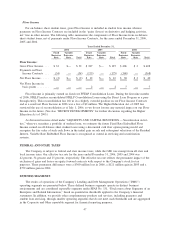
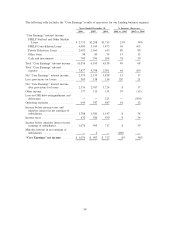
The following table summarizes “Core Earnings” securitization adjustments for the Lending operating
segment for the years ended December 31, 2006, 2005 and 2004.
2006 2005 2004
Years Ended December 31,
“Core Earnings” securitization adjustments:
Net interest income on securitized loans, after provisions for losses .... $(880) $(935) $(1,065)
Gains on student loan securitizations ........................... 902 552 375
Servicing and securitization revenue ........................... 553 357 561
Intercompany transactions with off-balance sheet trusts ............. (43) (34) (23)
Total “Core Earnings” securitization adjustments .................. $532 $ (60) $ (152)
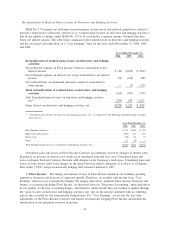
2) Derivative Accounting: “Core Earnings” exclude periodic unrealized gains and losses arising
primarily in our Lending operating segment, and to a lesser degree in our Corporate and Other reportable
segment, that are caused primarily by the one-sided mark-to-market derivative valuations prescribed by
SFAS No. 133 on derivatives that do not qualify for “hedge treatment” under GAAP. In our “Core Earnings”
presentation, we recognize the economic effect of these hedges, which generally results in any cash paid or
received being recognized ratably as an expense or revenue over the hedged item’s life. “Core Earnings” also
exclude the gain or loss on equity forward contracts that under SFAS No. 133, are required to be accounted
for as derivatives and are marked-to-market through earnings.
SFAS No. 133 requires that changes in the fair value of derivative instruments be recognized currently in
earnings unless specific hedge accounting criteria, as specified by SFAS No. 133, are met. We believe that our
derivatives are effective economic hedges, and as such, are a critical element of our interest rate risk
management strategy. However, some of our derivatives, primarily Floor Income Contracts, certain basis swaps
and equity forward contracts (discussed in detail below), do not qualify for “hedge treatment” as defined by
SFAS No. 133, and the stand-alone derivative must be marked-to-market in the income statement with no
consideration for the corresponding change in fair value of the hedged item. The gains and losses described in
“Gains (losses) on derivative and hedging activities, net” are primarily caused by interest rate and foreign
52