Sallie Mae 2006 Annual Report Download - page 48
Download and view the complete annual report
Please find page 48 of the 2006 Sallie Mae annual report below. You can navigate through the pages in the report by either clicking on the pages listed below, or by using the keyword search tool below to find specific information within the annual report.-
 1
1 -
2
-
3
-
4
-
5
-
6
-
7
-
8
-
9
-
10
-
11
-
12
-
13
-
14
-
15
-
16
-
17
-
18
-
19
-
20
-
21
-
22
-
23
-
24
-
25
-
26
-
27
-
28
-
29
-
30
-
31
-
32
-
33
-
34
-
35
-
36
-
37
-
 38
38 -
 39
39 -
 40
40 -
 41
41 -
 42
42 -
 43
43 -
 44
44 -
 45
45 -
 46
46 -
 47
47 -
 48
48 -
 49
49 -
 50
50 -
 51
51 -
 52
52 -
 53
53 -
 54
54 -
 55
55 -
 56
56 -
 57
57 -
 58
58 -
59
-
60
-
61
-
62
-
63
-
64
-
65
-
66
-
67
-
68
-
69
-
70
-
71
-
72
-
73
-
74
-
75
-
76
-
77
-
78
-
79
-
80
-
81
-
82
-
83
-
84
-
85
-
86
-
87
-
88
-
89
-
90
-
91
-
92
-
93
-
94
-
95
-
96
-
97
-
98
-
99
-
100
-
101
-
102
-
103
-
104
-
105
-
106
-
107
-
108
-
109
-
110
-
111
-
112
-
113
-
114
-
115
-
116
-
117
-
118
-
119
-
120
-
121
-
122
-
123
-
124
-
125
-
126
-
127
-
128
-
129
-
130
-
131
-
132
-
133
-
134
-
135
-
136
-
137
-
138
-
139
-
140
-
141
-
142
-
143
-
144
-
145
-
146
-
147
-
148
-
149
-
150
-
151
-
152
-
153
-
154
-
155
-
156
-
157
-
158
-
159
-
160
-
161
-
162
-
163
-
164
-
165
-
166
-
167
-
168
-
169
-
170
-
171
-
172
-
173
-
174
-
175
-
176
-
177
-
178
-
179
-
180
-
181
-
182
-
183
-
184
-
185
-
186
-
187
-
188
-
189
-
190
-
191
-
192
-
193
-
194
-
195
-
196
-
197
-
198
-
199
-
200
-
201
-
202
-
203
-
204
-
205
-
206
-
207
-
208
-
209
-
210
-
211
-
212
-
213
-
214
-
215
 |
 |

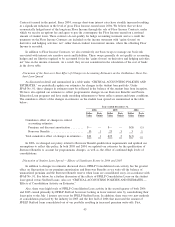
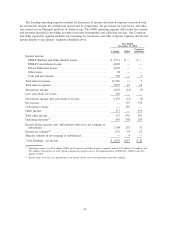
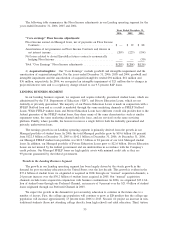
Floor Income
For on-balance sheet student loans, gross Floor Income is included in student loan income whereas
payments on Floor Income Contracts are included in the “gains (losses) on derivative and hedging activities,
net” line in other income. The following table summarizes the components of Floor Income from on-balance
sheet student loans, net of payments under Floor Income Contracts, for the years ended December 31, 2006,
2005 and 2004.
Fixed
Borrower
Rate
Variable
Borrower
Rate Total
Fixed
Borrower
Rate
Variable
Borrower
Rate Total
Fixed
Borrower
Rate
Variable
Borrower
Rate Total
2006 2005 2004
Years Ended December 31,
Floor Income:
Gross Floor Income.... $32 $— $32 $187 $— $187 $406 $ 2 $408
Payments on Floor
Income Contracts . . . (34) — (34) (175) — (175) (368) — (368)
Net Floor Income ..... $ (2) $— $ (2) $ 12 $— $ 12 $ 38 $ 2 $ 40
Net Floor Income in
basis points ........ — — — 2 — 2 7 — 7
Floor Income is primarily earned on fixed rate FFELP Consolidation Loans. During the first nine months
of 2006, FFELP lenders reconsolidated FFELP Consolidation Loans using the Direct Loan Program as a pass-
through entity. This reconsolidation has left us in a slightly oversold position on our Floor Income Contracts
and as a result net Floor Income in 2006 was a loss of $2 million. The Higher Education Act of 2005 has
restricted the use of reconsolidation as of July 1, 2006, so we do not foresee any material impact on our Floor
Income in the future. (See also “RECENT DEVELOPMENTS” for further discussion regarding the Higher
Education Act of 2005.)
As discussed in more detail under “LIQUIDITY AND CAPITAL RESOURCES — Securitization Activi-
ties,” when we securitize a portfolio of student loans, we estimate the future Fixed Rate Embedded Floor
Income earned on off-balance sheet student loans using a discounted cash flow option pricing model and
recognize the fair value of such cash flows in the initial gain on sale and subsequent valuations of the Residual
Interest. Variable Rate Embedded Floor Income is recognized as earned in servicing and securitization
revenue.
FEDERAL AND STATE TAXES
The Company is subject to federal and state income taxes, while the GSE was exempt from all state and
local income taxes. Our effective tax rate for the years ended December 31, 2006, 2005 and 2004 was
42 percent, 34 percent and 25 percent, respectively. The effective tax rate reflects the permanent impact of the
exclusion of gains and losses on equity forward contracts with respect to the Company’s stock for tax
purposes. These permanent differences were a $360 million loss in 2006, a $121 million gain in 2005 and a
$759 million gain in 2004.
BUSINESS SEGMENTS
The results of operations of the Company’s Lending and Debt Management Operations (“DMO”)
operating segments are presented below. These defined business segments operate in distinct business
environments and are considered reportable segments under SFAS No. 131, “Disclosures about Segments of an
Enterprise and Related Information,” based on quantitative thresholds applied to the Company’s financial
statements. In addition, we provide other complementary products and services, including guarantor and
student loan servicing, through smaller operating segments that do not meet such thresholds and are aggregated
in the Corporate and Other reportable segment for financial reporting purposes.
47