Sallie Mae 2006 Annual Report Download - page 83
Download and view the complete annual report
Please find page 83 of the 2006 Sallie Mae annual report below. You can navigate through the pages in the report by either clicking on the pages listed below, or by using the keyword search tool below to find specific information within the annual report.-
 1
1 -
2
-
3
-
4
-
5
-
6
-
7
-
8
-
9
-
10
-
11
-
12
-
13
-
14
-
15
-
16
-
17
-
18
-
19
-
20
-
21
-
22
-
23
-
24
-
25
-
26
-
27
-
28
-
29
-
30
-
31
-
32
-
33
-
34
-
35
-
36
-
37
-
38
-
39
-
40
-
41
-
42
-
43
-
44
-
45
-
46
-
47
-
48
-
49
-
50
-
51
-
52
-
53
-
54
-
55
-
56
-
57
-
58
-
59
-
60
-
61
-
62
-
63
-
64
-
65
-
66
-
67
-
68
-
69
-
70
-
71
-
72
-
 73
73 -
 74
74 -
 75
75 -
 76
76 -
 77
77 -
 78
78 -
 79
79 -
 80
80 -
 81
81 -
 82
82 -
 83
83 -
 84
84 -
 85
85 -
 86
86 -
 87
87 -
 88
88 -
 89
89 -
 90
90 -
 91
91 -
 92
92 -
 93
93 -
94
-
95
-
96
-
97
-
98
-
99
-
100
-
101
-
102
-
103
-
104
-
105
-
106
-
107
-
108
-
109
-
110
-
111
-
112
-
113
-
114
-
115
-
116
-
117
-
118
-
119
-
120
-
121
-
122
-
123
-
124
-
125
-
126
-
127
-
128
-
129
-
130
-
131
-
132
-
133
-
134
-
135
-
136
-
137
-
138
-
139
-
140
-
141
-
142
-
143
-
144
-
145
-
146
-
147
-
148
-
149
-
150
-
151
-
152
-
153
-
154
-
155
-
156
-
157
-
158
-
159
-
160
-
161
-
162
-
163
-
164
-
165
-
166
-
167
-
168
-
169
-
170
-
171
-
172
-
173
-
174
-
175
-
176
-
177
-
178
-
179
-
180
-
181
-
182
-
183
-
184
-
185
-
186
-
187
-
188
-
189
-
190
-
191
-
192
-
193
-
194
-
195
-
196
-
197
-
198
-
199
-
200
-
201
-
202
-
203
-
204
-
205
-
206
-
207
-
208
-
209
-
210
-
211
-
212
-
213
-
214
-
215
 |
 |

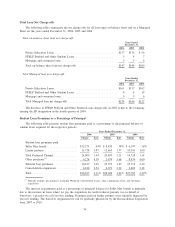
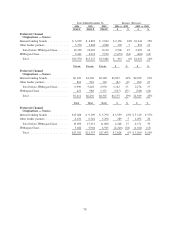
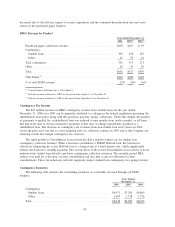
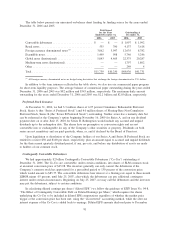
The increase in consolidations to third parties in 2006 reflects FFELP lenders reconsolidating FFELP
Consolidation Loans using the Direct Loan program as a pass-through entity, a practice which was severely
restricted by The Higher Education Reconciliation Act of 2005 as of July 1, 2006. The increase also reflects
the effect of the repeal of the single holder rule, which was effective for applications received on or after
June 15, 2006. The single-holder rule had previously required that when a lender held all of the FFELP
Stafford loans of a particular borrower whose loans were held by a single lender, in most cases that borrower
could only obtain a FFELP Consolidation Loan from that lender.
During 2006, Private Education Loan consolidations were introduced as a separate product line and
during the year we had $50 million of net incremental volume on a Managed Basis. We expect this product
line to grow in the future and will aggressively protect our portfolio against third-party consolidation of Private
Education Loans.
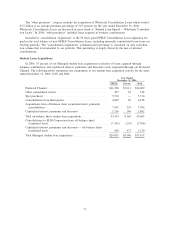
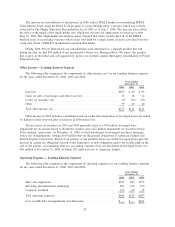
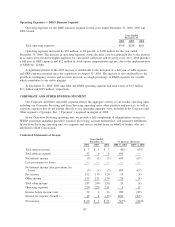
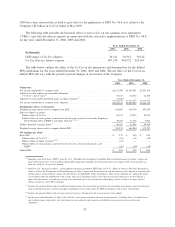
Other Income — Lending Business Segment
The following table summarizes the components of other income, net, for our Lending business segment
for the years ended December 31, 2006, 2005 and 2004.
2006 2005 2004
Years Ended
December 31,
Late fees ................................................... $107 $ 89 $ 92
Gains on sales of mortgages and other loan fees...................... 15 18 22
Losses on securities, net ....................................... (4) (36) (23)
Other ..................................................... 59 40 40
Total other income, net ........................................ $177 $111 $131
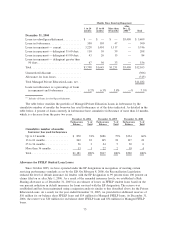
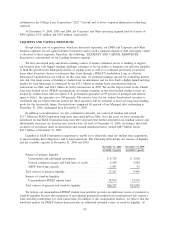
Other income in 2006 includes a settlement received on the final disposition of leveraged leases for which
we had previously reserved, plus an increase in forbearance fees.
The net losses on securities in 2005 and 2004 primarily relate to a $39 million leveraged lease
impairment for an aircraft leased to Northwest Airlines and a $27 million impairment for aircraft leased to
Delta Airlines, respectively. At December 31, 2006, we had investments in leveraged and direct financing
leases, net of impairments, totaling $109 million that are the general obligations of American Airlines and
Federal Express Corporation. Based on an analysis of the potential losses on certain leveraged leases plus the
increase in current tax obligations related to the forgiveness of debt obligations and/or the taxable gain on the
sale of the aircraft, our remaining after-tax accounting exposure from our investment in leveraged leases was
$69 million at December 31, 2006, of which $52 million relates to American Airlines.
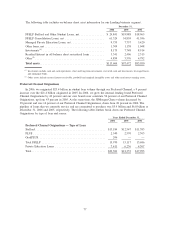
Operating Expense — Lending Business Segment
The following table summarizes the components of operating expenses for our Lending business segment
for the years ended December 31, 2006, 2005 and 2004.
2006 2005 2004
Years Ended
December 31,
Sales and originations ......................................... $327 285 $259
Servicing and information technology ............................. 201 193 150
Corporate overhead ........................................... 117 69 78
Total operating expenses ....................................... $645 $547 $487
Loss on GSE debt extinguishment and defeasance .................... $ — $ — $221
82