Sallie Mae 2006 Annual Report Download - page 16
Download and view the complete annual report
Please find page 16 of the 2006 Sallie Mae annual report below. You can navigate through the pages in the report by either clicking on the pages listed below, or by using the keyword search tool below to find specific information within the annual report.-
 1
1 -
2
-
3
-
4
-
5
-
 6
6 -
 7
7 -
 8
8 -
 9
9 -
 10
10 -
 11
11 -
 12
12 -
 13
13 -
 14
14 -
 15
15 -
 16
16 -
 17
17 -
 18
18 -
 19
19 -
 20
20 -
 21
21 -
 22
22 -
 23
23 -
 24
24 -
 25
25 -
 26
26 -
27
-
28
-
29
-
30
-
31
-
32
-
33
-
34
-
35
-
36
-
37
-
38
-
39
-
40
-
41
-
42
-
43
-
44
-
45
-
46
-
47
-
48
-
49
-
50
-
51
-
52
-
53
-
54
-
55
-
56
-
57
-
58
-
59
-
60
-
61
-
62
-
63
-
64
-
65
-
66
-
67
-
68
-
69
-
70
-
71
-
72
-
73
-
74
-
75
-
76
-
77
-
78
-
79
-
80
-
81
-
82
-
83
-
84
-
85
-
86
-
87
-
88
-
89
-
90
-
91
-
92
-
93
-
94
-
95
-
96
-
97
-
98
-
99
-
100
-
101
-
102
-
103
-
104
-
105
-
106
-
107
-
108
-
109
-
110
-
111
-
112
-
113
-
114
-
115
-
116
-
117
-
118
-
119
-
120
-
121
-
122
-
123
-
124
-
125
-
126
-
127
-
128
-
129
-
130
-
131
-
132
-
133
-
134
-
135
-
136
-
137
-
138
-
139
-
140
-
141
-
142
-
143
-
144
-
145
-
146
-
147
-
148
-
149
-
150
-
151
-
152
-
153
-
154
-
155
-
156
-
157
-
158
-
159
-
160
-
161
-
162
-
163
-
164
-
165
-
166
-
167
-
168
-
169
-
170
-
171
-
172
-
173
-
174
-
175
-
176
-
177
-
178
-
179
-
180
-
181
-
182
-
183
-
184
-
185
-
186
-
187
-
188
-
189
-
190
-
191
-
192
-
193
-
194
-
195
-
196
-
197
-
198
-
199
-
200
-
201
-
202
-
203
-
204
-
205
-
206
-
207
-
208
-
209
-
210
-
211
-
212
-
213
-
214
-
215
 |
 |
Securitization is currently and is likely to continue to be our principal source of financing. We expect
approximately 75 percent of our funding needs in 2007 will be satisfied by securitizing our loan assets and
issuing asset-backed securities.
Sallie Mae Bank
On November 3, 2005, we announced that the Utah Department of Financial Institutions approved our
application for an industrial bank charter. Beginning in February and August 2006, Sallie Mae Bank began
funding and originating Private Education Loans and FFELP Consolidation Loans, respectively, made by Sallie
Mae to students and families nationwide. This allows us to capture the full economics of these loans from
origination. In addition, the industrial bank charter allows us to expand the products and services we can offer
to students and families. In addition to using Sallie Mae Bank to fund and originate Private Education Loans,
we expect to continue to originate a significant portion of our Private Education Loans through our strategic
lending partners. In addition, we have deposited custodial funds from AMS and Upromise in Sallie Mae Bank.
These funds are used for low cost financing for Sallie Mae Bank.
Competition
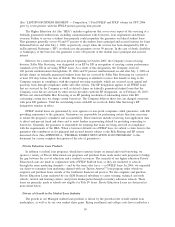
Our primary competitor for federally guaranteed student loans is the FDLP, which in its first four years of
existence (FFYs 1994-1997) grew market share from four percent in FFY 1994 to a peak of 34 percent in
FFY 1997, but has steadily declined since then to a 21 percent market share in FFY 2006 for the total
federally sponsored student loan market. We also face competition for both federally guaranteed and non-
guaranteed student loans from a variety of financial institutions including banks, thrifts and state-supported
secondary markets. In addition, we face competition for FFELP Consolidation Loans from a number of
direct-to-consumer firms that entered the market for FFELP Consolidation Loans over the past few years in
response to the increased borrower demand for FFELP Consolidation Loans and low barriers to entry (see
“Risk Factors — GENERAL”). Our FFY 2006 FFELP Preferred Channel Originations totaled $16 billion,
representing a 27 percent market share.
In November 2005, we launched a zero-fee pricing initiative on all FFELP Stafford Loans on a trial basis.
For AY 2006-2007 we expanded this competitive initiative nationwide, such that we pay the federally
mandated two percent origination fee on behalf of the borrower. While the goal of this pricing initiative is to
grow our FFELP loan volume, this strategy will reduce our margins on the affected student loans until the
origination fee is completely eliminated by legislation in 2010.
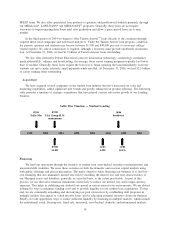
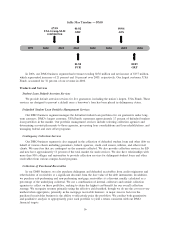
DEBT MANAGEMENT OPERATIONS BUSINESS SEGMENT
We have used strategic acquisitions to build our DMO business and now have six operating units that
comprise our DMO business segment. In our DMO segment, we provide a wide range of accounts receivable
and collections services including student loan default aversion services, defaulted student loan portfolio
management services, contingency collections services for student loans and other asset classes, primarily a
contingency or pay for performance business. We also provide accounts receivable management and
collections services on consumer and mortgage receivable portfolios that we purchase. The table below
presents a timeline of key acquisitions that have fueled the growth of our DMO business.
In recent years we have diversified our DMO contingency revenue stream away from student loans into
the purchase of distressed and defaulted receivables marketplace. We now have the expertise to acquire and
manage portfolios of sub-performing and non-performing mortgage loans, substantially all of which are
secured by one-to-four family residential real estate. We also have a servicing platform and a disciplined
portfolio pricing approach to several consumer debt asset classes. We are now in the position to offer the
purchase of distressed or defaulted debt to our partner schools as an additional method of enhancing their
receivables management strategies. The diversification into purchased paper has lowered student loan contin-
gency fees to 48 percent of total DMO revenue in 2006, versus 75 percent in 2004.
15