Sallie Mae 2006 Annual Report Download - page 177
Download and view the complete annual report
Please find page 177 of the 2006 Sallie Mae annual report below. You can navigate through the pages in the report by either clicking on the pages listed below, or by using the keyword search tool below to find specific information within the annual report.-
 1
1 -
2
-
3
-
4
-
5
-
6
-
7
-
8
-
9
-
10
-
11
-
12
-
13
-
14
-
15
-
16
-
17
-
18
-
19
-
20
-
21
-
22
-
23
-
24
-
25
-
26
-
27
-
28
-
29
-
30
-
31
-
32
-
33
-
34
-
35
-
36
-
37
-
38
-
39
-
40
-
41
-
42
-
43
-
44
-
45
-
46
-
47
-
48
-
49
-
50
-
51
-
52
-
53
-
54
-
55
-
56
-
57
-
58
-
59
-
60
-
61
-
62
-
63
-
64
-
65
-
66
-
67
-
68
-
69
-
70
-
71
-
72
-
73
-
74
-
75
-
76
-
77
-
78
-
79
-
80
-
81
-
82
-
83
-
84
-
85
-
86
-
87
-
88
-
89
-
90
-
91
-
92
-
93
-
94
-
95
-
96
-
97
-
98
-
99
-
100
-
101
-
102
-
103
-
104
-
105
-
106
-
107
-
108
-
109
-
110
-
111
-
112
-
113
-
114
-
115
-
116
-
117
-
118
-
119
-
120
-
121
-
122
-
123
-
124
-
125
-
126
-
127
-
128
-
129
-
130
-
131
-
132
-
133
-
134
-
135
-
136
-
137
-
138
-
139
-
140
-
141
-
142
-
143
-
144
-
145
-
146
-
147
-
148
-
149
-
150
-
151
-
152
-
153
-
154
-
155
-
156
-
157
-
158
-
159
-
160
-
161
-
162
-
163
-
164
-
165
-
166
-
 167
167 -
 168
168 -
 169
169 -
 170
170 -
 171
171 -
 172
172 -
 173
173 -
 174
174 -
 175
175 -
 176
176 -
 177
177 -
 178
178 -
 179
179 -
 180
180 -
 181
181 -
 182
182 -
 183
183 -
 184
184 -
 185
185 -
 186
186 -
 187
187 -
188
-
189
-
190
-
191
-
192
-
193
-
194
-
195
-
196
-
197
-
198
-
199
-
200
-
201
-
202
-
203
-
204
-
205
-
206
-
207
-
208
-
209
-
210
-
211
-
212
-
213
-
214
-
215
 |
 |

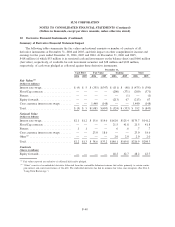
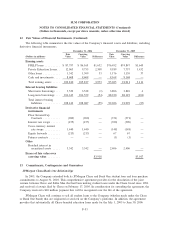
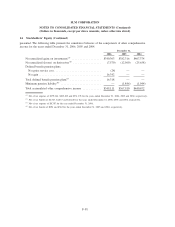
14. Stockholders’ Equity (Continued)
presented. The following table presents the cumulative balances of the components of other comprehensive
income for the years ended December 31, 2006, 2005 and 2004.
2006 2005 2004
December 31,
Net unrealized gains on investments
(1)
................... $340,363 $382,316 $467,374
Net unrealized (losses) on derivatives
(2)
.................. (7,570) (12,560) (25,658)
Defined benefit pension plans:
Net prior service cost .............................. (24) — —
Net gain ........................................ 16,342 — —
Total defined benefit pension plans
(3)
.................... 16,318 — —
Minimum pension liability
(4)
.......................... — (1,846) (1,044)
Total accumulated other comprehensive income . . . ......... $349,111 $367,910 $440,672
(1)
Net of tax expense of $179,244, $203,495 and $251,178 for the years ended December 31, 2006, 2005 and 2004, respectively.
(2)
Net of tax benefit of $4,347, $4,667 and $12,220 for the years ended December 31, 2006, 2005 and 2004, respectively.
(3)
Net of tax expense of $8,787 for the year ended December 31, 2006.
(4)
Net of tax benefit of $994 and $562 for the years ended December 31, 2005 and 2004, respectively.
F-58
SLM CORPORATION
NOTES TO CONSOLIDATED FINANCIAL STATEMENTS (Continued)
(Dollars in thousands, except per share amounts, unless otherwise stated)