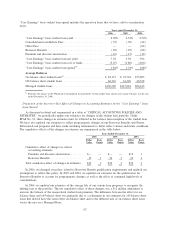
Sallie Mae 2006 Annual Report Download - page 73
Download and view the complete annual report
Please find page 73 of the 2006 Sallie Mae annual report below. You can navigate through the pages in the report by either clicking on the pages listed below, or by using the keyword search tool below to find specific information within the annual report.-
 1
1 -
2
-
3
-
4
-
5
-
6
-
7
-
8
-
9
-
10
-
11
-
12
-
13
-
14
-
15
-
16
-
17
-
18
-
19
-
20
-
21
-
22
-
23
-
24
-
25
-
26
-
27
-
28
-
29
-
30
-
31
-
32
-
33
-
34
-
35
-
36
-
37
-
38
-
39
-
40
-
41
-
42
-
43
-
44
-
45
-
46
-
47
-
48
-
49
-
50
-
51
-
52
-
53
-
54
-
55
-
56
-
57
-
58
-
59
-
60
-
61
-
62
-
 63
63 -
 64
64 -
 65
65 -
 66
66 -
 67
67 -
 68
68 -
 69
69 -
 70
70 -
 71
71 -
 72
72 -
 73
73 -
 74
74 -
 75
75 -
 76
76 -
 77
77 -
 78
78 -
 79
79 -
 80
80 -
 81
81 -
 82
82 -
 83
83 -
84
-
85
-
86
-
87
-
88
-
89
-
90
-
91
-
92
-
93
-
94
-
95
-
96
-
97
-
98
-
99
-
100
-
101
-
102
-
103
-
104
-
105
-
106
-
107
-
108
-
109
-
110
-
111
-
112
-
113
-
114
-
115
-
116
-
117
-
118
-
119
-
120
-
121
-
122
-
123
-
124
-
125
-
126
-
127
-
128
-
129
-
130
-
131
-
132
-
133
-
134
-
135
-
136
-
137
-
138
-
139
-
140
-
141
-
142
-
143
-
144
-
145
-
146
-
147
-
148
-
149
-
150
-
151
-
152
-
153
-
154
-
155
-
156
-
157
-
158
-
159
-
160
-
161
-
162
-
163
-
164
-
165
-
166
-
167
-
168
-
169
-
170
-
171
-
172
-
173
-
174
-
175
-
176
-
177
-
178
-
179
-
180
-
181
-
182
-
183
-
184
-
185
-
186
-
187
-
188
-
189
-
190
-
191
-
192
-
193
-
194
-
195
-
196
-
197
-
198
-
199
-
200
-
201
-
202
-
203
-
204
-
205
-
206
-
207
-
208
-
209
-
210
-
211
-
212
-
213
-
214
-
215
 |
 |

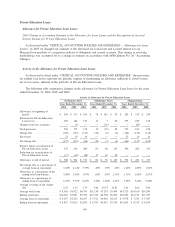
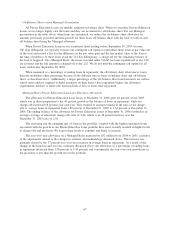
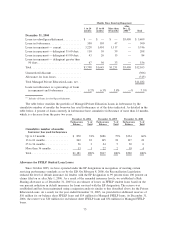
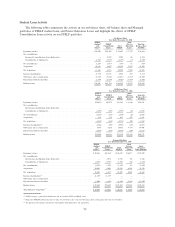
The tables below show the composition and status of the Private Education Loan portfolio by number of
months aged from the first date of repayment:
1to24
months
25 to 48
months
More than
48 months
After
Dec. 31,
2006
(1)
Total
Months Since Entering Repayment
December 31, 2006
Loans in-school/grace/deferment ........... $ — $ — $ — $10,826 $10,826
Loans in forbearance .................... 898 209 74 — 1,181
Loans in repayment — current ............. 6,273 2,477 1,883 — 10,633
Loans in repayment — delinquent 31-60 days . . 271 119 82 — 472
Loans in repayment — delinquent 61-90 days . . 109 49 34 — 192
Loans in repayment — delinquent greater than
90 days ............................ 157 117 72 — 346
Total ................................ $7,708 $2,971 $2,145 $10,826 $23,650
Unamortized discount ................... (668)
Allowance for loan losses ................ (394)
Total Managed Private Education Loans, net . . . $22,588
Loans in forbearance as a percentage of loans
in repayment and forbearance ............ 11.7% 7.1% 3.4% —% 9.2%
(1)
Includes all loans in-school/grace/deferment.
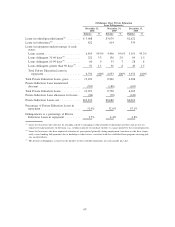
1to24
months
25 to 48
months
More than
48 months
After
Dec. 31,
2005
(1)
Total
Months Since Entering Repayment
December 31, 2005
Loans in-school/grace/deferment ........... $ — $ — $ — $7,980 $ 7,980
Loans in forbearance.................... 667 173 77 — 917
Loans in repayment — current............. 4,508 1,796 1,453 — 7,757
Loans in repayment — delinquent 31-60 days. . 168 78 56 — 302
Loans in repayment — delinquent 61-90 days. . 63 30 19 — 112
Loans in repayment — delinquent greater than
90 days ............................ 72 44 28 — 144
Total ............................... $5,478 $2,121 $1,633 $7,980 $17,212
Unamortized discount ................... (493)
Allowance for loan losses ................ (282)
Total Managed Private Education Loans, net . . $16,437
Loans in forbearance as a percentage of loans
in repayment and forbearance ........... 12.2% 8.2% 4.7% —% 9.9%
(1)
Includes all loans in-school/grace/deferment.
72