Sallie Mae 2006 Annual Report Download - page 86
Download and view the complete annual report
Please find page 86 of the 2006 Sallie Mae annual report below. You can navigate through the pages in the report by either clicking on the pages listed below, or by using the keyword search tool below to find specific information within the annual report.-
 1
1 -
2
-
3
-
4
-
5
-
6
-
7
-
8
-
9
-
10
-
11
-
12
-
13
-
14
-
15
-
16
-
17
-
18
-
19
-
20
-
21
-
22
-
23
-
24
-
25
-
26
-
27
-
28
-
29
-
30
-
31
-
32
-
33
-
34
-
35
-
36
-
37
-
38
-
39
-
40
-
41
-
42
-
43
-
44
-
45
-
46
-
47
-
48
-
49
-
50
-
51
-
52
-
53
-
54
-
55
-
56
-
57
-
58
-
59
-
60
-
61
-
62
-
63
-
64
-
65
-
66
-
67
-
68
-
69
-
70
-
71
-
72
-
73
-
74
-
75
-
 76
76 -
 77
77 -
 78
78 -
 79
79 -
 80
80 -
 81
81 -
 82
82 -
 83
83 -
 84
84 -
 85
85 -
 86
86 -
 87
87 -
 88
88 -
 89
89 -
 90
90 -
 91
91 -
 92
92 -
 93
93 -
 94
94 -
 95
95 -
 96
96 -
97
-
98
-
99
-
100
-
101
-
102
-
103
-
104
-
105
-
106
-
107
-
108
-
109
-
110
-
111
-
112
-
113
-
114
-
115
-
116
-
117
-
118
-
119
-
120
-
121
-
122
-
123
-
124
-
125
-
126
-
127
-
128
-
129
-
130
-
131
-
132
-
133
-
134
-
135
-
136
-
137
-
138
-
139
-
140
-
141
-
142
-
143
-
144
-
145
-
146
-
147
-
148
-
149
-
150
-
151
-
152
-
153
-
154
-
155
-
156
-
157
-
158
-
159
-
160
-
161
-
162
-
163
-
164
-
165
-
166
-
167
-
168
-
169
-
170
-
171
-
172
-
173
-
174
-
175
-
176
-
177
-
178
-
179
-
180
-
181
-
182
-
183
-
184
-
185
-
186
-
187
-
188
-
189
-
190
-
191
-
192
-
193
-
194
-
195
-
196
-
197
-
198
-
199
-
200
-
201
-
202
-
203
-
204
-
205
-
206
-
207
-
208
-
209
-
210
-
211
-
212
-
213
-
214
-
215
 |
 |

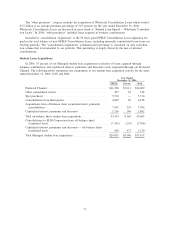
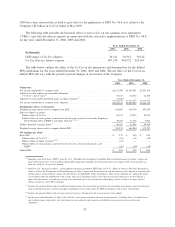
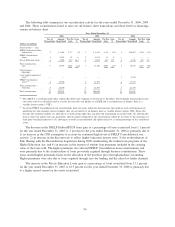
decreased due to the full year impact of recent acquisitions and the continued diversification into new asset
classes in the purchased paper business.
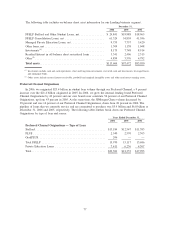
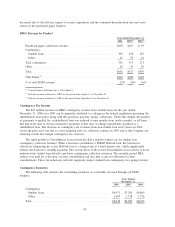
DMO Revenue by Product
2006 2005
(2)
2004
(3)
Years Ended December 31,
Purchased paper collections revenue ............................. $239 $167 $ 39
Contingency:
Student loans ............................................ 305 258 253
Other .................................................. 36 55 18
Total contingency ........................................... 341 313 271
Other .................................................... 56 47 29
Total..................................................... $636 $527 $339
USA Funds
(1)
.............................................. $204 $180 $190
% of total DMO revenue ...................................... 32% 34% 56%
(1)
United Student Aid Funds, Inc. (“USA Funds”).
(2)
Includes revenue attributed to GRP for the period from August 31 to December 31.
(3)
Includes revenue attributed to AFS for the period from September 16 to December 31.
Contingency Fee Income
The $47 million increase in DMO contingency revenue from student loans for the year ended
December 31, 2006 over 2005 can be primarily attributed to a change in the federal regulations governing the
rehabilitation loan policy along with the growth in guaranty agency collections. Under this change, the number
of payments to qualify for a rehabilitated loan was reduced to nine months from twelve months, so all loans
that had made nine to eleven consecutive payments at thet time of change immediately qualified as a
rehabilitated loan. The decrease in contingency fee revenues from non-student loan asset classes in 2006
versus the prior year was due to a non-recurring state tax collection contract in 2005 and to the Company not
renewing certain low margin contingency fee contracts.
The rapid growth in Consolidation Loan activity has had a negative impact on our student loan
contingency collection business. When a borrower consolidates a FFELP Stafford loan, the borrower is
effectively refinancing his or her Stafford loan to a longer term at a fixed interest rate, which significantly
reduces the borrower’s monthly payment. The overall effect of the record Consolidation Loan activity is lower
industry-wide student loan defaults and lower contingency collection inventory. The recently passed HEA
reduces fees paid for collections via loan consolidation and also puts a cap on collections for loan
consolidations. These fee reductions will also negatively impact student loan contingency fees going forward.
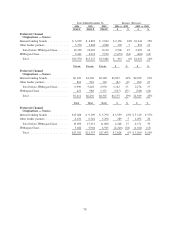
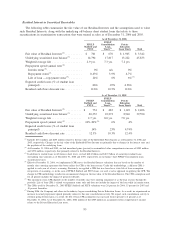
Contingency Inventory
The following table presents the outstanding inventory of receivables serviced through our DMO
business.
2006 2005 2004
Years Ended
December 31,
Contingency:
Student loans ......................................... $6,971 $7,205 $6,869
Other ............................................... 1,667 2,178 1,756
Total.................................................. $8,638 $9,383 $8,625
85