Sallie Mae 2006 Annual Report Download - page 91
Download and view the complete annual report
Please find page 91 of the 2006 Sallie Mae annual report below. You can navigate through the pages in the report by either clicking on the pages listed below, or by using the keyword search tool below to find specific information within the annual report.-
 1
1 -
2
-
3
-
4
-
5
-
6
-
7
-
8
-
9
-
10
-
11
-
12
-
13
-
14
-
15
-
16
-
17
-
18
-
19
-
20
-
21
-
22
-
23
-
24
-
25
-
26
-
27
-
28
-
29
-
30
-
31
-
32
-
33
-
34
-
35
-
36
-
37
-
38
-
39
-
40
-
41
-
42
-
43
-
44
-
45
-
46
-
47
-
48
-
49
-
50
-
51
-
52
-
53
-
54
-
55
-
56
-
57
-
58
-
59
-
60
-
61
-
62
-
63
-
64
-
65
-
66
-
67
-
68
-
69
-
70
-
71
-
72
-
73
-
74
-
75
-
76
-
77
-
78
-
79
-
80
-
 81
81 -
 82
82 -
 83
83 -
 84
84 -
 85
85 -
 86
86 -
 87
87 -
 88
88 -
 89
89 -
 90
90 -
 91
91 -
 92
92 -
 93
93 -
 94
94 -
 95
95 -
 96
96 -
 97
97 -
 98
98 -
 99
99 -
 100
100 -
 101
101 -
102
-
103
-
104
-
105
-
106
-
107
-
108
-
109
-
110
-
111
-
112
-
113
-
114
-
115
-
116
-
117
-
118
-
119
-
120
-
121
-
122
-
123
-
124
-
125
-
126
-
127
-
128
-
129
-
130
-
131
-
132
-
133
-
134
-
135
-
136
-
137
-
138
-
139
-
140
-
141
-
142
-
143
-
144
-
145
-
146
-
147
-
148
-
149
-
150
-
151
-
152
-
153
-
154
-
155
-
156
-
157
-
158
-
159
-
160
-
161
-
162
-
163
-
164
-
165
-
166
-
167
-
168
-
169
-
170
-
171
-
172
-
173
-
174
-
175
-
176
-
177
-
178
-
179
-
180
-
181
-
182
-
183
-
184
-
185
-
186
-
187
-
188
-
189
-
190
-
191
-
192
-
193
-
194
-
195
-
196
-
197
-
198
-
199
-
200
-
201
-
202
-
203
-
204
-
205
-
206
-
207
-
208
-
209
-
210
-
211
-
212
-
213
-
214
-
215
 |
 |

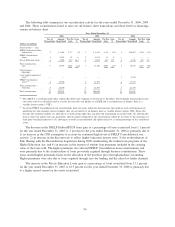
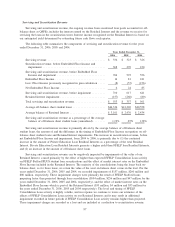
December 31, 2006, we had $365 million of investments on our balance sheet that were pledged as collateral
related to certain derivative positions and $99 million of other non-liquid investments, neither of which were
included in the above table.
In addition to liquidity, a major objective when financing our business is to minimize interest rate risk by
matching the interest rate and reset characteristics of our Managed assets and liabilities, generally on a pooled
basis, to the extent practicable. In this process we use derivative financial instruments extensively to reduce
our interest rate and foreign currency exposure. This interest rate risk management helps us to stabilize our
student loan spread in various and changing interest rate environments. (See also “RISKS — Interest Rate Risk
Management” below.)
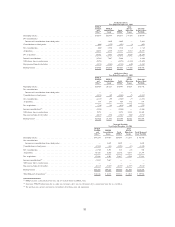
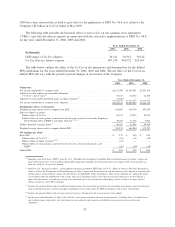
The following tables present the ending and average balances and average interest rates of our Managed
borrowings for the years ended December 31, 2006, 2005 and 2004. The average interest rates include
derivatives that are economically hedging the underlying debt but do not qualify for hedge accounting
treatment under SFAS No. 133. (See “BUSINESS SEGMENTS — Limitations of ‘Core Earnings’ — Deriva-
tive Accounting — Reclassification of Realized Gains (Losses) on Derivative and Hedging Activities.”)
Short
Term
Long
Term
Total
Managed
Basis
Short
Term
Long
Term
Total
Managed
Basis
Short
Term
Long
Term
Total
Managed
Basis
Ending Balance Ending Balance Ending Balance
2006 2005 2004
Years Ended December 31,
Unsecured borrowings . ............ $3,435 $ 45,501 $ 48,936 $3,787 $ 37,944 $ 41,731 $1,830 $ 31,465 $ 33,295
Indentured trusts (on-balance sheet) . . . . 93 2,852 2,945 23 3,372 3,395 377 6,873 7,250
Securitizations (on-balance sheet) ...... — 55,100 55,100 — 47,235 47,235 — 35,769 35,769
Securitizations (off-balance sheet) . . . . . — 49,865 49,865 — 43,138 43,138 — 43,814 43,814
Total . . ...................... $3,528 $153,318 $156,846 $3,810 $131,689 $135,499 $2,207 $117,921 $120,128
Average
Balance
Average
Rate
Average
Balance
Average
Rate
Average
Balance
Average
Rate
2006 2005 2004
Years Ended December 31,
GSE borrowings (unsecured) . . ........................ $ — —% $ — —% $ 9,967 2.21%
Unsecured borrowings . ............................. 43,927 5.50 37,980 3.98 28,241 2.29
Indentured trusts (on-balance sheet) . . . ................... 3,252 4.57 4,782 3.27 2,168 2.47
Securitizations (on-balance sheet) ....................... 48,184 5.39 39,713 3.72 28,354 1.79
Securitizations (off-balance sheet) ....................... 50,112 5.49 44,545 3.77 42,606 2.09
Total . . . ....................................... $145,475 5.44% $127,020 3.80% $111,336 2.08%
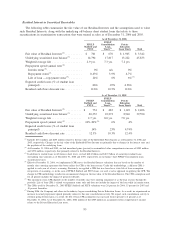
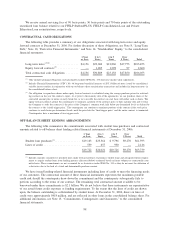
Unsecured On-Balance Sheet Financing Activities
The following table presents the senior unsecured credit ratings on our debt from major rating agencies as
of December 31, 2006.
S&P Moody’s Fitch
Short-term unsecured debt ..................................... A-1 P-1 F1+
Long-term unsecured debt ..................................... A A2 A+
90