Sallie Mae 2006 Annual Report Download - page 97
Download and view the complete annual report
Please find page 97 of the 2006 Sallie Mae annual report below. You can navigate through the pages in the report by either clicking on the pages listed below, or by using the keyword search tool below to find specific information within the annual report.-
 1
1 -
2
-
3
-
4
-
5
-
6
-
7
-
8
-
9
-
10
-
11
-
12
-
13
-
14
-
15
-
16
-
17
-
18
-
19
-
20
-
21
-
22
-
23
-
24
-
25
-
26
-
27
-
28
-
29
-
30
-
31
-
32
-
33
-
34
-
35
-
36
-
37
-
38
-
39
-
40
-
41
-
42
-
43
-
44
-
45
-
46
-
47
-
48
-
49
-
50
-
51
-
52
-
53
-
54
-
55
-
56
-
57
-
58
-
59
-
60
-
61
-
62
-
63
-
64
-
65
-
66
-
67
-
68
-
69
-
70
-
71
-
72
-
73
-
74
-
75
-
76
-
77
-
78
-
79
-
80
-
81
-
82
-
83
-
84
-
85
-
86
-
 87
87 -
 88
88 -
 89
89 -
 90
90 -
 91
91 -
 92
92 -
 93
93 -
 94
94 -
 95
95 -
 96
96 -
 97
97 -
 98
98 -
 99
99 -
 100
100 -
 101
101 -
 102
102 -
 103
103 -
 104
104 -
 105
105 -
 106
106 -
 107
107 -
108
-
109
-
110
-
111
-
112
-
113
-
114
-
115
-
116
-
117
-
118
-
119
-
120
-
121
-
122
-
123
-
124
-
125
-
126
-
127
-
128
-
129
-
130
-
131
-
132
-
133
-
134
-
135
-
136
-
137
-
138
-
139
-
140
-
141
-
142
-
143
-
144
-
145
-
146
-
147
-
148
-
149
-
150
-
151
-
152
-
153
-
154
-
155
-
156
-
157
-
158
-
159
-
160
-
161
-
162
-
163
-
164
-
165
-
166
-
167
-
168
-
169
-
170
-
171
-
172
-
173
-
174
-
175
-
176
-
177
-
178
-
179
-
180
-
181
-
182
-
183
-
184
-
185
-
186
-
187
-
188
-
189
-
190
-
191
-
192
-
193
-
194
-
195
-
196
-
197
-
198
-
199
-
200
-
201
-
202
-
203
-
204
-
205
-
206
-
207
-
208
-
209
-
210
-
211
-
212
-
213
-
214
-
215
 |
 |

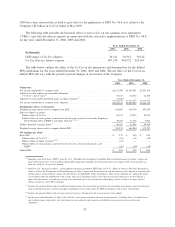
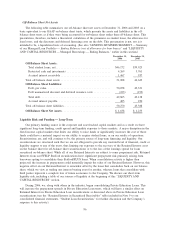
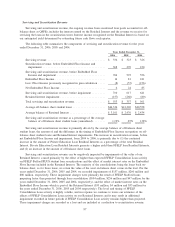
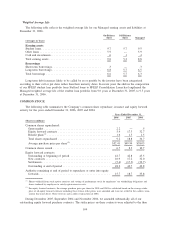
Off-Balance Sheet Net Assets
The following table summarizes our off-balance sheet net assets at December 31, 2006 and 2005 on a
basis equivalent to our GAAP on-balance sheet trusts, which presents the assets and liabilities in the off-
balance sheet trusts as if they were being accounted for on-balance sheet rather than off-balance sheet. This
presentation, therefore, includes a theoretical calculation of the premiums on student loans, the allowance for
loan losses, and the discounts and deferred financing costs on the debt. This presentation is not, nor is it
intended to be, a liquidation basis of accounting. (See also “LENDING BUSINESS SEGMENT — Summary
of our Managed Loan Portfolio — Ending Balances (net of allowance for loan losses)” and “LIQUIDITY
AND CAPITAL RESOURCES — Managed Borrowings — Ending Balances,” earlier in this section.)
December 31,
2006
December 31,
2005
Off-Balance Sheet Assets:
Total student loans, net ................................... $46,172 $39,925
Restricted cash and investments ............................ 4,269 3,761
Accrued interest receivable ................................ 1,467 937
Total off-balance sheet assets ................................ 51,908 44,623
Off-Balance Sheet Liabilities:
Debt, par value ......................................... 50,058 43,331
Debt unamortized discount and deferred issuance costs ........... (193) (193)
Total debt............................................. 49,865 43,138
Accrued interest payable .................................. 405 250
Total off-balance sheet liabilities.............................. 50,270 43,388
Off-Balance Sheet Net Assets ............................... $ 1,638 $ 1,235
Liquidity Risk and Funding — Long-Term
Our primary funding source is the corporate and asset-backed capital markets and as a result we have
significant long-term funding, credit spread and liquidity exposure to those markets. A major disruption in the
fixed income capital markets that limits our ability to raise funds or significantly increases the cost of those
funds could have a material impact on our ability to acquire student loans, or on our results of operations.
Securitizations are, and will continue to be, the primary source of long-term financing and liquidity. Our
securitizations are structured such that we are not obligated to provide any material level of financial, credit or
liquidity support to any of the trusts, thus limiting our exposure to the recovery of the Retained Interest asset
on the balance sheet for off-balance sheet securitizations or to the loss of the earnings spread for loans
securitized on-balance sheet. While all of our Retained Interests are subject to some prepayment risk, Retained
Interests from our FFELP Stafford securitizations have significant prepayment risk primarily arising from
borrowers opting to consolidate their Stafford/PLUS loans. When consolidation activity is higher than
projected, the increase in prepayment could materially impair the value of our Retained Interest. However, this
negative effect on our Retained Interest is somewhat offset by the loans that consolidate back on our balance
sheet, which we view as trading one interest bearing asset for another, whereas loans that consolidate with
third parties represent a complete loss of future economics to the Company. We discuss our short-term
liquidity risk, including a table of our sources of liquidity at the beginning of this “LIQUIDITY AND
CAPITAL RESOURCES” section.
During 2006, we, along with others in the industry, began consolidating Private Education Loans. This
will increase the prepayment spreads in Private Education Loan trusts, which will have a similar effect on
Retained Interests in Private Education Loan securitizations as discussed above in Private Education Loan
securitizations (see the “Retained Interest in Securitized Receivables” table included in Note 9 to our
consolidated financial statements, “Student Loan Securitization,” for further discussion and the Company’s
response to this activity).
96