Sallie Mae 2006 Annual Report Download - page 46
Download and view the complete annual report
Please find page 46 of the 2006 Sallie Mae annual report below. You can navigate through the pages in the report by either clicking on the pages listed below, or by using the keyword search tool below to find specific information within the annual report.-
 1
1 -
2
-
3
-
4
-
5
-
6
-
7
-
8
-
9
-
10
-
11
-
12
-
13
-
14
-
15
-
16
-
17
-
18
-
19
-
20
-
21
-
22
-
23
-
24
-
25
-
26
-
27
-
28
-
29
-
30
-
31
-
32
-
33
-
34
-
35
-
 36
36 -
 37
37 -
 38
38 -
 39
39 -
 40
40 -
 41
41 -
 42
42 -
 43
43 -
 44
44 -
 45
45 -
 46
46 -
 47
47 -
 48
48 -
 49
49 -
 50
50 -
 51
51 -
 52
52 -
 53
53 -
 54
54 -
 55
55 -
 56
56 -
57
-
58
-
59
-
60
-
61
-
62
-
63
-
64
-
65
-
66
-
67
-
68
-
69
-
70
-
71
-
72
-
73
-
74
-
75
-
76
-
77
-
78
-
79
-
80
-
81
-
82
-
83
-
84
-
85
-
86
-
87
-
88
-
89
-
90
-
91
-
92
-
93
-
94
-
95
-
96
-
97
-
98
-
99
-
100
-
101
-
102
-
103
-
104
-
105
-
106
-
107
-
108
-
109
-
110
-
111
-
112
-
113
-
114
-
115
-
116
-
117
-
118
-
119
-
120
-
121
-
122
-
123
-
124
-
125
-
126
-
127
-
128
-
129
-
130
-
131
-
132
-
133
-
134
-
135
-
136
-
137
-
138
-
139
-
140
-
141
-
142
-
143
-
144
-
145
-
146
-
147
-
148
-
149
-
150
-
151
-
152
-
153
-
154
-
155
-
156
-
157
-
158
-
159
-
160
-
161
-
162
-
163
-
164
-
165
-
166
-
167
-
168
-
169
-
170
-
171
-
172
-
173
-
174
-
175
-
176
-
177
-
178
-
179
-
180
-
181
-
182
-
183
-
184
-
185
-
186
-
187
-
188
-
189
-
190
-
191
-
192
-
193
-
194
-
195
-
196
-
197
-
198
-
199
-
200
-
201
-
202
-
203
-
204
-
205
-
206
-
207
-
208
-
209
-
210
-
211
-
212
-
213
-
214
-
215
 |
 |

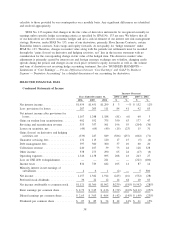
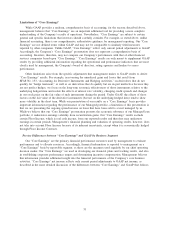
Contracts) earned in the period. Since 2004, average short-term interest rates have steadily increased resulting
in a significant reduction in the level of gross Floor Income earned since 2004. We believe that we have
economically hedged most of the long-term Floor Income through the sale of Floor Income Contracts, under
which we receive an upfront fee and agree to pay the counterparty the Floor Income earned on a notional
amount of student loans. These contracts do not qualify for hedge accounting treatment and as a result the
payments on the Floor Income Contracts are included on the income statement with “gains (losses) on
derivative and hedging activities, net” rather than in student loan interest income, where the offsetting Floor
Income is recorded.
In addition to Floor Income Contracts, we also extensively use basis swaps to manage our basis risk
associated with interest rate sensitive assets and liabilities. These swaps generally do not qualify as accounting
hedges and are likewise required to be accounted for in the “gains (losses) on derivative and hedging activities,
net” line on the income statement. As a result, they are not considered in the calculation of the cost of funds
in the above table.
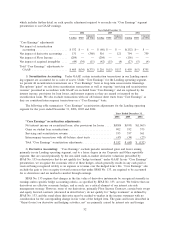
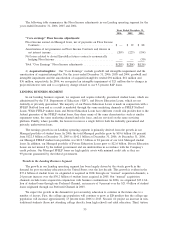
Discussion of the Year-over-Year Effect of Changes in Accounting Estimates on the On-Balance Sheet Stu-
dent Loan Spread
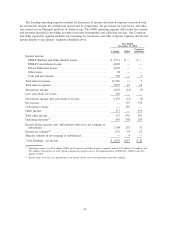
As discussed in detail and summarized in a table under “CRITICAL ACCOUNTING POLICIES AND
ESTIMATES,” we periodically update our estimates for changes in the student loan portfolio. Under
SFAS No. 91, these changes in estimates must be reflected in the balance of the student loan from inception.
We have also updated our estimates to reflect programmatic changes in our Borrower Benefits and Private
Education Loan programs and have made modeling refinements to better reflect current and future conditions.
The cumulative effects of the changes in estimates on the student loan spread are summarized in the table
below:
Dollar
Value
Basis
Points
Dollar
Value
Basis
Points
Dollar
Value
Basis
Points
2006 2005 2004
Years ended December 31,
Cumulative effect of changes in critical
accounting estimates:
Premium and discount amortization ........ $— — $— — $(8) (1)
Borrower Benefits ..................... 10 1 23 3 5 1
Total cumulative effect of changes in estimates . . $10 1 $23 3 $(3) —
In 2006, we changed our policy related to Borrower Benefit qualification requirements and updated our
assumptions to reflect this policy. In both 2005 and 2004, we updated our estimates for the qualification of
Borrower Benefits to account for programmatic changes, as well as, the effect of continued high levels of
consolidations.
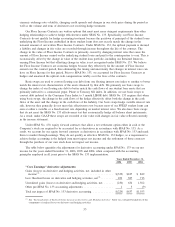
Discussion of Student Loan Spread — Effects of Significant Events in 2006 and 2005
In addition to changes in estimates discussed above, FFELP Consolidation Loan activity has the greatest
effect on fluctuations in our premium amortization and Borrower Benefits as we write-off the balance of
unamortized premium and the Borrower Benefit reserve when loans are consolidated away, in accordance with
SFAS No. 91. See below for a further discussion of the effects of FFELP Consolidation Loans on the student
loan spread versus Stafford Loans. Also see “CRITICAL ACCOUNTING POLICIES AND ESTIMATES —
Effects of Consolidation Activity on Estimates.”
Also, there were high levels of FFELP Consolidation Loan activity in the second quarter of both 2006
and 2005 caused primarily by FFELP Stafford borrowers locking in lower interest rates by consolidating their
loans prior to the July 1 interest rate reset for FFELP Stafford loans. In addition, there were two new methods
of consolidation practiced by the industry in 2005 and the first half of 2006 that increased the amount of
FFELP Stafford loans consolidated out of our portfolio resulting in increased premium write-offs. First,
45