Sallie Mae 2006 Annual Report Download - page 84
Download and view the complete annual report
Please find page 84 of the 2006 Sallie Mae annual report below. You can navigate through the pages in the report by either clicking on the pages listed below, or by using the keyword search tool below to find specific information within the annual report.-
 1
1 -
2
-
3
-
4
-
5
-
6
-
7
-
8
-
9
-
10
-
11
-
12
-
13
-
14
-
15
-
16
-
17
-
18
-
19
-
20
-
21
-
22
-
23
-
24
-
25
-
26
-
27
-
28
-
29
-
30
-
31
-
32
-
33
-
34
-
35
-
36
-
37
-
38
-
39
-
40
-
41
-
42
-
43
-
44
-
45
-
46
-
47
-
48
-
49
-
50
-
51
-
52
-
53
-
54
-
55
-
56
-
57
-
58
-
59
-
60
-
61
-
62
-
63
-
64
-
65
-
66
-
67
-
68
-
69
-
70
-
71
-
72
-
73
-
 74
74 -
 75
75 -
 76
76 -
 77
77 -
 78
78 -
 79
79 -
 80
80 -
 81
81 -
 82
82 -
 83
83 -
 84
84 -
 85
85 -
 86
86 -
 87
87 -
 88
88 -
 89
89 -
 90
90 -
 91
91 -
 92
92 -
 93
93 -
 94
94 -
95
-
96
-
97
-
98
-
99
-
100
-
101
-
102
-
103
-
104
-
105
-
106
-
107
-
108
-
109
-
110
-
111
-
112
-
113
-
114
-
115
-
116
-
117
-
118
-
119
-
120
-
121
-
122
-
123
-
124
-
125
-
126
-
127
-
128
-
129
-
130
-
131
-
132
-
133
-
134
-
135
-
136
-
137
-
138
-
139
-
140
-
141
-
142
-
143
-
144
-
145
-
146
-
147
-
148
-
149
-
150
-
151
-
152
-
153
-
154
-
155
-
156
-
157
-
158
-
159
-
160
-
161
-
162
-
163
-
164
-
165
-
166
-
167
-
168
-
169
-
170
-
171
-
172
-
173
-
174
-
175
-
176
-
177
-
178
-
179
-
180
-
181
-
182
-
183
-
184
-
185
-
186
-
187
-
188
-
189
-
190
-
191
-
192
-
193
-
194
-
195
-
196
-
197
-
198
-
199
-
200
-
201
-
202
-
203
-
204
-
205
-
206
-
207
-
208
-
209
-
210
-
211
-
212
-
213
-
214
-
215
 |
 |
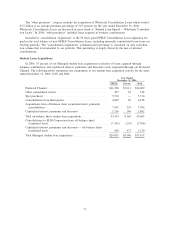
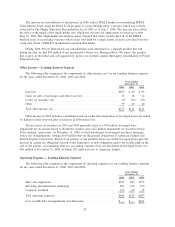
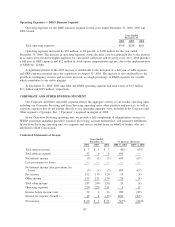
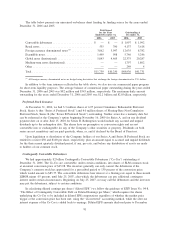
Operating expenses for our Lending operating segment include non-capitalizable costs incurred to acquire
student loans and service our Managed student loan portfolio, as well as other selling, general and
administrative expenses.
The $221 million loss in 2004 relates to the repurchase and defeasance of approximately $3.0 billion of
GSE debt in connection with the Wind-Down of the GSE.
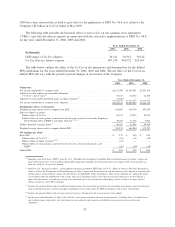
2006 versus 2005
Operating expenses for the year ended December 31, 2006, increased by 18 percent to $645 million
versus $547 million for the year ended December 31, 2005. The increase is primarily due to sales and
marketing expenses related to our direct to consumer initiatives and to higher sales expenses for higher
education loan products. The increase was also due to an increase in origination and servicing costs, consistent
with the increase in origination volume and the number of borrowers. In 2006, corporate overhead includes
$34 million of stock option compensation expense, due to the implementation of SFAS No. 123(R).
2005 versus 2004
Operating expenses for the year ended December 31, 2005, increased by 12 percent to $547 million
versus $487 million for the year ended December 31, 2004, exclusive of the loss on GSE debt extinguishment
and defeasance. The increase is due to increased sales and marketing costs related to the FFELP Consolidation
Loan program, new Private Education Loan initiatives and the launch of our direct to consumer initiative,
Tuition Answer. Operating expenses were also higher due to a full year of expenses of sales and marketing
personnel from Southwest and SLFA, acquired in the fourth quarter of 2004. The $43 million increase in
servicing and information technology expenses is consistent with the growth in borrowers.
83