Sallie Mae 2006 Annual Report Download - page 181
Download and view the complete annual report
Please find page 181 of the 2006 Sallie Mae annual report below. You can navigate through the pages in the report by either clicking on the pages listed below, or by using the keyword search tool below to find specific information within the annual report.-
 1
1 -
2
-
3
-
4
-
5
-
6
-
7
-
8
-
9
-
10
-
11
-
12
-
13
-
14
-
15
-
16
-
17
-
18
-
19
-
20
-
21
-
22
-
23
-
24
-
25
-
26
-
27
-
28
-
29
-
30
-
31
-
32
-
33
-
34
-
35
-
36
-
37
-
38
-
39
-
40
-
41
-
42
-
43
-
44
-
45
-
46
-
47
-
48
-
49
-
50
-
51
-
52
-
53
-
54
-
55
-
56
-
57
-
58
-
59
-
60
-
61
-
62
-
63
-
64
-
65
-
66
-
67
-
68
-
69
-
70
-
71
-
72
-
73
-
74
-
75
-
76
-
77
-
78
-
79
-
80
-
81
-
82
-
83
-
84
-
85
-
86
-
87
-
88
-
89
-
90
-
91
-
92
-
93
-
94
-
95
-
96
-
97
-
98
-
99
-
100
-
101
-
102
-
103
-
104
-
105
-
106
-
107
-
108
-
109
-
110
-
111
-
112
-
113
-
114
-
115
-
116
-
117
-
118
-
119
-
120
-
121
-
122
-
123
-
124
-
125
-
126
-
127
-
128
-
129
-
130
-
131
-
132
-
133
-
134
-
135
-
136
-
137
-
138
-
139
-
140
-
141
-
142
-
143
-
144
-
145
-
146
-
147
-
148
-
149
-
150
-
151
-
152
-
153
-
154
-
155
-
156
-
157
-
158
-
159
-
160
-
161
-
162
-
163
-
164
-
165
-
166
-
167
-
168
-
169
-
170
-
 171
171 -
 172
172 -
 173
173 -
 174
174 -
 175
175 -
 176
176 -
 177
177 -
 178
178 -
 179
179 -
 180
180 -
 181
181 -
 182
182 -
 183
183 -
 184
184 -
 185
185 -
 186
186 -
 187
187 -
 188
188 -
 189
189 -
 190
190 -
 191
191 -
192
-
193
-
194
-
195
-
196
-
197
-
198
-
199
-
200
-
201
-
202
-
203
-
204
-
205
-
206
-
207
-
208
-
209
-
210
-
211
-
212
-
213
-
214
-
215
 |
 |

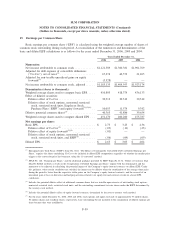
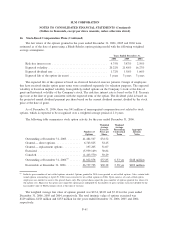
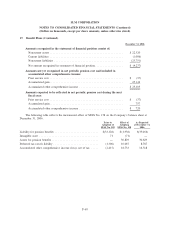
16. Stock-Based Compensation Plans (Continued)
Cash received from option exercises was $152 million for the year ended December 31, 2006. The actual
tax benefit realized for the tax deductions from option exercises totaled $47 million for the year ended
December 31, 2006.
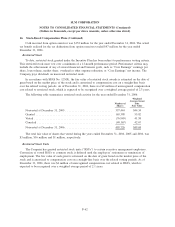
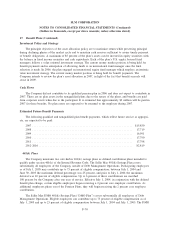
Restricted Stock
To date, restricted stock granted under the Incentive Plan has been subject to performance vesting criteria.
This restricted stock must vest over a minimum of a 12-month performance period. Performance criteria may
include the achievement of any of several financial and business goals, such as “Core Earnings” earnings per
share, loan volume, market share, overhead or other expense reduction, or “Core Earnings” net income. The
Company pays dividends on nonvested restricted stock.
In accordance with SFAS No. 123(R), the fair value of restricted stock awards is estimated on the date of
grant based on the market price of the stock and is amortized to compensation cost on a straight-line basis
over the related vesting periods. As of December 31, 2006, there was $9 million of unrecognized compensation
cost related to restricted stock, which is expected to be recognized over a weighted average period of 2.3 years.
The following table summarizes restricted stock activity for the year ended December 31, 2006.
Number of
Shares
Weighted
Average Grant
Date
Fair Value
Nonvested at December 31, 2005 .............................. 357,444 $44.34
Granted ................................................. 163,398 55.82
Vested .................................................. (76,949) 41.58
Canceled ................................................ (40,167) 42.67
Nonvested at December 31, 2006 .............................. 403,726 $49.68
The total fair value of shares that vested during the years ended December 31, 2006, 2005 and 2004, was
$3 million, $16 million and $1 million, respectively.
Restricted Stock Units
The Company has granted restricted stock units (“RSUs”) to certain executive management employees.
Conversion of vested RSUs to common stock is deferred until the employees’ retirement or termination of
employment. The fair value of each grant is estimated on the date of grant based on the market price of the
stock and is amortized to compensation cost on a straight-line basis over the related vesting periods. As of
December 31, 2006, there was $6 million of unrecognized compensation cost related to RSUs, which is
expected to be recognized over a weighted average period of 2.1 years.
F-62
SLM CORPORATION
NOTES TO CONSOLIDATED FINANCIAL STATEMENTS (Continued)
(Dollars in thousands, except per share amounts, unless otherwise stated)