Sallie Mae 2006 Annual Report Download - page 79
Download and view the complete annual report
Please find page 79 of the 2006 Sallie Mae annual report below. You can navigate through the pages in the report by either clicking on the pages listed below, or by using the keyword search tool below to find specific information within the annual report.-
 1
1 -
2
-
3
-
4
-
5
-
6
-
7
-
8
-
9
-
10
-
11
-
12
-
13
-
14
-
15
-
16
-
17
-
18
-
19
-
20
-
21
-
22
-
23
-
24
-
25
-
26
-
27
-
28
-
29
-
30
-
31
-
32
-
33
-
34
-
35
-
36
-
37
-
38
-
39
-
40
-
41
-
42
-
43
-
44
-
45
-
46
-
47
-
48
-
49
-
50
-
51
-
52
-
53
-
54
-
55
-
56
-
57
-
58
-
59
-
60
-
61
-
62
-
63
-
64
-
65
-
66
-
67
-
68
-
 69
69 -
 70
70 -
 71
71 -
 72
72 -
 73
73 -
 74
74 -
 75
75 -
 76
76 -
 77
77 -
 78
78 -
 79
79 -
 80
80 -
 81
81 -
 82
82 -
 83
83 -
 84
84 -
 85
85 -
 86
86 -
 87
87 -
 88
88 -
 89
89 -
90
-
91
-
92
-
93
-
94
-
95
-
96
-
97
-
98
-
99
-
100
-
101
-
102
-
103
-
104
-
105
-
106
-
107
-
108
-
109
-
110
-
111
-
112
-
113
-
114
-
115
-
116
-
117
-
118
-
119
-
120
-
121
-
122
-
123
-
124
-
125
-
126
-
127
-
128
-
129
-
130
-
131
-
132
-
133
-
134
-
135
-
136
-
137
-
138
-
139
-
140
-
141
-
142
-
143
-
144
-
145
-
146
-
147
-
148
-
149
-
150
-
151
-
152
-
153
-
154
-
155
-
156
-
157
-
158
-
159
-
160
-
161
-
162
-
163
-
164
-
165
-
166
-
167
-
168
-
169
-
170
-
171
-
172
-
173
-
174
-
175
-
176
-
177
-
178
-
179
-
180
-
181
-
182
-
183
-
184
-
185
-
186
-
187
-
188
-
189
-
190
-
191
-
192
-
193
-
194
-
195
-
196
-
197
-
198
-
199
-
200
-
201
-
202
-
203
-
204
-
205
-
206
-
207
-
208
-
209
-
210
-
211
-
212
-
213
-
214
-
215
 |
 |

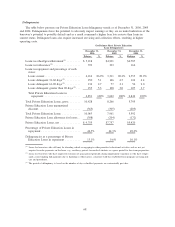
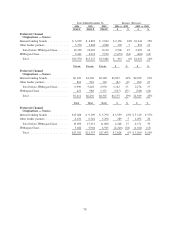
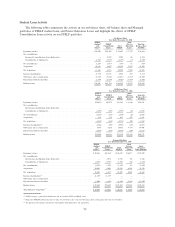
FFELP FFELP FFELP $ % $ %
2006 2005 2004 2006 vs. 2005 2005 vs. 2004
Years Ended December 31, Increase (Decrease)
Preferred Channel
Originations — Source
Internal lending brands .............. $ 6,939 $ 4,803 $ 3,562 $ 2,136 44% $1,241 35%
Other lender partners ................ 5,770 5,400 4,548 370 7 852 19
Total before JPMorgan Chase ........ 12,709 10,203 8,110 2,506 25 2,093 26
JPMorgan Chase ................... 3,261 4,914 5,576 (1,653) (34) (662) (12)
Total .......................... $15,970 $15,117 $13,686 $ 853 6% $1,431 10%
Private Private Private $ % $ %
Preferred Channel
Originations — Source
Internal lending brands. . ............ $6,129 $4,306 $2,228 $1,823 42% $2,078 93%
Other lender partners . . . ............ 861 942 742 (81) (9) 200 27
Total before JPMorgan Chase ....... 6,990 5,248 2,970 1,742 33 2,278 77
JPMorgan Chase .................. 421 988 1,337 (567) (57) (349) (26)
Total ......................... $7,411 $6,236 $4,307 $1,175 19% $1,929 45%
Total Total Total $ % $ %
Preferred Channel
Originations — Source
Internal lending brands ............. $13,068 $ 9,109 $ 5,790 $ 3,959 43% $ 3,319 $ 57%
Other lender partners ............... 6,631 6,342 5,290 289 5 1,052 20
Total before JPMorgan Chase....... 19,699 15,451 11,080 4,248 27 4,371 39
JPMorgan Chase .................. 3,682 5,902 6,913 (2,220) (38) (1,011) (15)
Total ......................... $23,381 $21,353 $17,993 $ 2,028 9% $ 3,360 $ 19%
78