Sallie Mae 2006 Annual Report Download - page 12
Download and view the complete annual report
Please find page 12 of the 2006 Sallie Mae annual report below. You can navigate through the pages in the report by either clicking on the pages listed below, or by using the keyword search tool below to find specific information within the annual report.-
 1
1 -
 2
2 -
 3
3 -
 4
4 -
 5
5 -
 6
6 -
 7
7 -
 8
8 -
 9
9 -
 10
10 -
 11
11 -
 12
12 -
 13
13 -
 14
14 -
 15
15 -
 16
16 -
 17
17 -
 18
18 -
 19
19 -
 20
20 -
 21
21 -
 22
22 -
23
-
24
-
25
-
26
-
27
-
28
-
29
-
30
-
31
-
32
-
33
-
34
-
35
-
36
-
37
-
38
-
39
-
40
-
41
-
42
-
43
-
44
-
45
-
46
-
47
-
48
-
49
-
50
-
51
-
52
-
53
-
54
-
55
-
56
-
57
-
58
-
59
-
60
-
61
-
62
-
63
-
64
-
65
-
66
-
67
-
68
-
69
-
70
-
71
-
72
-
73
-
74
-
75
-
76
-
77
-
78
-
79
-
80
-
81
-
82
-
83
-
84
-
85
-
86
-
87
-
88
-
89
-
90
-
91
-
92
-
93
-
94
-
95
-
96
-
97
-
98
-
99
-
100
-
101
-
102
-
103
-
104
-
105
-
106
-
107
-
108
-
109
-
110
-
111
-
112
-
113
-
114
-
115
-
116
-
117
-
118
-
119
-
120
-
121
-
122
-
123
-
124
-
125
-
126
-
127
-
128
-
129
-
130
-
131
-
132
-
133
-
134
-
135
-
136
-
137
-
138
-
139
-
140
-
141
-
142
-
143
-
144
-
145
-
146
-
147
-
148
-
149
-
150
-
151
-
152
-
153
-
154
-
155
-
156
-
157
-
158
-
159
-
160
-
161
-
162
-
163
-
164
-
165
-
166
-
167
-
168
-
169
-
170
-
171
-
172
-
173
-
174
-
175
-
176
-
177
-
178
-
179
-
180
-
181
-
182
-
183
-
184
-
185
-
186
-
187
-
188
-
189
-
190
-
191
-
192
-
193
-
194
-
195
-
196
-
197
-
198
-
199
-
200
-
201
-
202
-
203
-
204
-
205
-
206
-
207
-
208
-
209
-
210
-
211
-
212
-
213
-
214
-
215
 |
 |

doubling in the size of the federally insured student loan market over the last 10 years. Student loan
originations grew from $17.8 billion in FFY 1996 to $47.3 billion in FFY 2006.
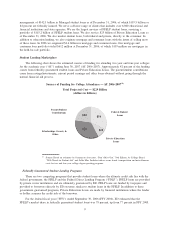
According to the College Board, tuition and fees at four-year public institutions and four-year private
institutions have increased 51 percent and 32 percent, respectively, in constant, inflation-adjusted dollars, since
AY 1996-1997. Under the FFELP, there are limits to the amount students can borrow each academic year. The
first loan limit increases since 1992 will be implemented July 1, 2007 when freshman and sophomore limits will
be increased to $3,500 and $4,500 from $2,625 and $3,500, respectively. The fact that guaranteed student loan
limits have not kept pace with tuition increases has driven more students and parents to Private Education Loans
to meet an increasing portion of their education financing needs. Loans — both federal and private — as a
percentage of total student aid have increased from 55 percent of total student aid in AY 1996-1997 to 56 percent
in AY 2005-2006. Private Education Loans accounted for 20 percent of total student loans — both federally
guaranteed and Private Education Loans — in AY 2005-2006, compared to six percent in AY 1996-1997.
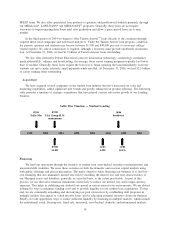
ED predicts that the college-age population will increase approximately 13 percent from 2006 to 2015.
Demand for education credit will also increase due to the rise in non-traditional students (those not attending
college directly from high school) and adult education.
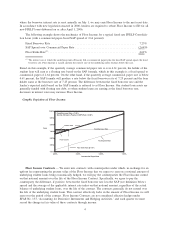
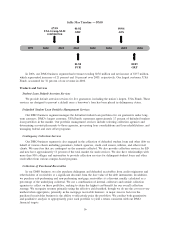
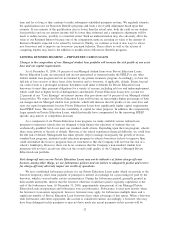
The following charts show the projected enrollment and average tuition and fee growth for four-year
public and private colleges and universities.
Projected Enrollment
14
15
16
17
18
19
20
1995
1997
1999
2001
2003
2005
2007
2009
2011
2013
2015
(In millions)
Actual Projected
Source: National Center for Education Statistics (NCES)
Cost of Attendance
(1)
Cumulative % Increase from AY 1996-1997
0
20
40
60
80
100
1997
1998
1999
2000
2001
2002
2003
2004
2005
2006
Tuition & Fees 4-Year Private
Tuition & Fees 4-Year Public
Source: The College Board
(1)
Cost of attendance is in current dollars and includes
tuition, fees and on-campus room and board.
11