Sallie Mae 2006 Annual Report Download - page 50
Download and view the complete annual report
Please find page 50 of the 2006 Sallie Mae annual report below. You can navigate through the pages in the report by either clicking on the pages listed below, or by using the keyword search tool below to find specific information within the annual report.-
 1
1 -
2
-
3
-
4
-
5
-
6
-
7
-
8
-
9
-
10
-
11
-
12
-
13
-
14
-
15
-
16
-
17
-
18
-
19
-
20
-
21
-
22
-
23
-
24
-
25
-
26
-
27
-
28
-
29
-
30
-
31
-
32
-
33
-
34
-
35
-
36
-
37
-
38
-
39
-
 40
40 -
 41
41 -
 42
42 -
 43
43 -
 44
44 -
 45
45 -
 46
46 -
 47
47 -
 48
48 -
 49
49 -
 50
50 -
 51
51 -
 52
52 -
 53
53 -
 54
54 -
 55
55 -
 56
56 -
 57
57 -
 58
58 -
 59
59 -
 60
60 -
61
-
62
-
63
-
64
-
65
-
66
-
67
-
68
-
69
-
70
-
71
-
72
-
73
-
74
-
75
-
76
-
77
-
78
-
79
-
80
-
81
-
82
-
83
-
84
-
85
-
86
-
87
-
88
-
89
-
90
-
91
-
92
-
93
-
94
-
95
-
96
-
97
-
98
-
99
-
100
-
101
-
102
-
103
-
104
-
105
-
106
-
107
-
108
-
109
-
110
-
111
-
112
-
113
-
114
-
115
-
116
-
117
-
118
-
119
-
120
-
121
-
122
-
123
-
124
-
125
-
126
-
127
-
128
-
129
-
130
-
131
-
132
-
133
-
134
-
135
-
136
-
137
-
138
-
139
-
140
-
141
-
142
-
143
-
144
-
145
-
146
-
147
-
148
-
149
-
150
-
151
-
152
-
153
-
154
-
155
-
156
-
157
-
158
-
159
-
160
-
161
-
162
-
163
-
164
-
165
-
166
-
167
-
168
-
169
-
170
-
171
-
172
-
173
-
174
-
175
-
176
-
177
-
178
-
179
-
180
-
181
-
182
-
183
-
184
-
185
-
186
-
187
-
188
-
189
-
190
-
191
-
192
-
193
-
194
-
195
-
196
-
197
-
198
-
199
-
200
-
201
-
202
-
203
-
204
-
205
-
206
-
207
-
208
-
209
-
210
-
211
-
212
-
213
-
214
-
215
 |
 |

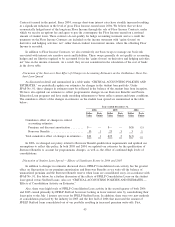
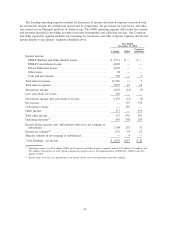
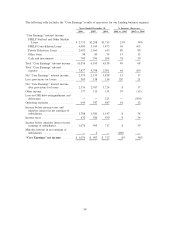
The Lending operating segment includes all discussion of income and related expenses associated with
the net interest margin, the student loan spread and its components, the provisions for loan losses, and other
fees earned on our Managed portfolio of student loans. The DMO operating segment reflects the fees earned
and expenses incurred in providing accounts receivable management and collection services. Our Corporate
and Other reportable segment includes our remaining fee businesses and other corporate expenses that do not
pertain directly to the primary segments identified above.
Lending DMO
Corporate
and Other
Year Ended
December 31, 2006
Interest income:
FFELP Stafford and Other Student Loans.................... $ 2,771 $ — $ —
FFELP Consolidation Loans ............................. 4,690 — —
Private Education Loans ................................ 2,092 — —
Other loans .......................................... 98 — —
Cash and investments .................................. 705 — 7
Total interest income ..................................... 10,356 — 7
Total interest expense .................................... 7,877 23 12
Net interest income ...................................... 2,479 (23) (5)
Less: provisions for losses ................................. 303 — —
Net interest income after provisions for losses .................. 2,176 (23) (5)
Fee income ............................................ — 397 132
Collections revenue ...................................... — 239 —
Other income .......................................... 177 — 155
Total other income ...................................... 177 636 287
Operating expenses
(1)
.................................... 645 358 250
Income before income taxes and minority interest in net earnings of
subsidiaries .......................................... 1,708 255 32
Income tax expense
(2)
.................................... 632 94 12
Minority interest in net earnings of subsidiaries ................. — 4 —
“Core Earnings” net income ............................... $ 1,076 $157 $ 20
(1)
Operating expenses for the Lending, DMO, and Corporate and Other business segments include $34 million, $12 million, and
$17 million, respectively, of stock option compensation expense due to the implementation of SFAS No. 123(R) in the first
quarter of 2006.
(2)
Income taxes are based on a percentage of net income before tax for the individual reportable segment.
49