Sallie Mae 2006 Annual Report Download - page 106
Download and view the complete annual report
Please find page 106 of the 2006 Sallie Mae annual report below. You can navigate through the pages in the report by either clicking on the pages listed below, or by using the keyword search tool below to find specific information within the annual report.-
 1
1 -
2
-
3
-
4
-
5
-
6
-
7
-
8
-
9
-
10
-
11
-
12
-
13
-
14
-
15
-
16
-
17
-
18
-
19
-
20
-
21
-
22
-
23
-
24
-
25
-
26
-
27
-
28
-
29
-
30
-
31
-
32
-
33
-
34
-
35
-
36
-
37
-
38
-
39
-
40
-
41
-
42
-
43
-
44
-
45
-
46
-
47
-
48
-
49
-
50
-
51
-
52
-
53
-
54
-
55
-
56
-
57
-
58
-
59
-
60
-
61
-
62
-
63
-
64
-
65
-
66
-
67
-
68
-
69
-
70
-
71
-
72
-
73
-
74
-
75
-
76
-
77
-
78
-
79
-
80
-
81
-
82
-
83
-
84
-
85
-
86
-
87
-
88
-
89
-
90
-
91
-
92
-
93
-
94
-
95
-
 96
96 -
 97
97 -
 98
98 -
 99
99 -
 100
100 -
 101
101 -
 102
102 -
 103
103 -
 104
104 -
 105
105 -
 106
106 -
 107
107 -
 108
108 -
 109
109 -
 110
110 -
 111
111 -
 112
112 -
 113
113 -
 114
114 -
 115
115 -
 116
116 -
117
-
118
-
119
-
120
-
121
-
122
-
123
-
124
-
125
-
126
-
127
-
128
-
129
-
130
-
131
-
132
-
133
-
134
-
135
-
136
-
137
-
138
-
139
-
140
-
141
-
142
-
143
-
144
-
145
-
146
-
147
-
148
-
149
-
150
-
151
-
152
-
153
-
154
-
155
-
156
-
157
-
158
-
159
-
160
-
161
-
162
-
163
-
164
-
165
-
166
-
167
-
168
-
169
-
170
-
171
-
172
-
173
-
174
-
175
-
176
-
177
-
178
-
179
-
180
-
181
-
182
-
183
-
184
-
185
-
186
-
187
-
188
-
189
-
190
-
191
-
192
-
193
-
194
-
195
-
196
-
197
-
198
-
199
-
200
-
201
-
202
-
203
-
204
-
205
-
206
-
207
-
208
-
209
-
210
-
211
-
212
-
213
-
214
-
215
 |
 |

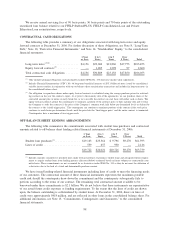
current market share prices of the common stock and the total number of shares under contract was reduced
from 46.5 million, 53.4 million and 49.0 million shares to 42.4 million, 46.7 million and 42.2 million shares,
respectively. As a result of these amendments, we received a total of 4.1 million and 13.4 million shares that
settled in 2005 and 2004, respectively, free and clear in cashless transactions. This reduction of shares covered
by the equity forward contracts is shown on a net basis in the “settlements” row of the table above.
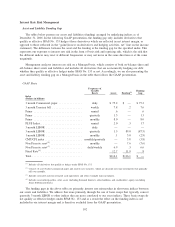
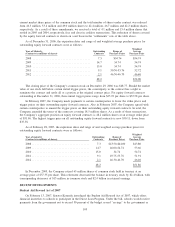
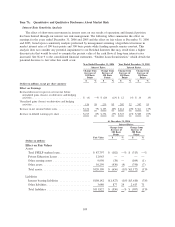
As of December 31, 2006, the expiration dates and range of and weighted average purchase prices for
outstanding equity forward contracts were as follows:
Year of Maturity
(Contracts in millions of shares)
Outstanding
Contracts
Range of
Purchase Prices
Weighted
Average
Purchase Price
2008 ..................................... 7.3 $54.74 $54.74
2009 ..................................... 14.7 54.74 54.74
2010 ..................................... 15.0 54.74 54.74
2011 ..................................... 9.1 50.30-53.76 52.72
2012 ..................................... 2.1 46.30-46.70 46.40
48.2 $54.00
The closing price of the Company’s common stock on December 29, 2006 was $48.77. Should the market
value of our stock fall below certain initial trigger prices, the counterparty to the contract has a right to
terminate the contract and settle all or a portion at the original contract price. For equity forward contracts
outstanding at December 31, 2006, these initial trigger prices range from $25.93 per share to $35.58 per share.
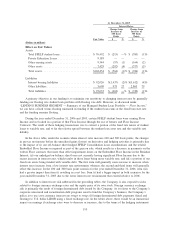
In February 2007, the Company made payments to certain counterparties to lower the strike prices and
trigger prices on their outstanding equity forward contracts. Also in February 2007, the Company agreed with
certain counterparties to amend the trigger prices on their outstanding equity forward contracts. In total, the
Company amended the terms of the contracts covering 18.5 million shares. As a result of these transactions,
the Company’s aggregate position on equity forward contracts is 48.2 million shares at an average strike price
of $51.86. The highest trigger price on all outstanding equity forward contracts is now $30.11, down from
$35.58.
As of February 28, 2007, the expiration dates and range of and weighted average purchase prices for
outstanding equity forward contracts were as follows:
Year of maturity
(Contracts in millions of shares)
Outstanding
Contracts
Range of
Purchase Prices
Weighted
Average
Purchase Price
2008 . . . .................................. 7.3 $43.50-$44.00 $43.80
2009 . . . .................................. 14.7 46.00-54.74 53.66
2010 . . . .................................. 15.0 54.74 54.74
2011 . . . .................................. 9.1 49.75-53.76 51.91
2012 . . . .................................. 2.1 46.30-46.70 46.40
48.2 $51.86
In December 2005, the Company retired 65 million shares of common stock held in treasury at an
average price of $37.35 per share. This retirement decreased the balance in treasury stock by $2.4 billion, with
corresponding decreases of $13 million in common stock and $2.4 billion in retained earnings.
RECENT DEVELOPMENTS
Student Aid Reward Act of 2007
On February 13, 2007, Senator Kennedy introduced the Student Aid Reward Act of 2007, which offers
financial incentives to schools to participate in the Direct Loan Program. Under the bill, schools would receive
payments from the government not to exceed 50 percent of the budget scored “savings” to the government as
105