Sallie Mae 2006 Annual Report Download - page 60
Download and view the complete annual report
Please find page 60 of the 2006 Sallie Mae annual report below. You can navigate through the pages in the report by either clicking on the pages listed below, or by using the keyword search tool below to find specific information within the annual report.-
 1
1 -
2
-
3
-
4
-
5
-
6
-
7
-
8
-
9
-
10
-
11
-
12
-
13
-
14
-
15
-
16
-
17
-
18
-
19
-
20
-
21
-
22
-
23
-
24
-
25
-
26
-
27
-
28
-
29
-
30
-
31
-
32
-
33
-
34
-
35
-
36
-
37
-
38
-
39
-
40
-
41
-
42
-
43
-
44
-
45
-
46
-
47
-
48
-
49
-
 50
50 -
 51
51 -
 52
52 -
 53
53 -
 54
54 -
 55
55 -
 56
56 -
 57
57 -
 58
58 -
 59
59 -
 60
60 -
 61
61 -
 62
62 -
 63
63 -
 64
64 -
 65
65 -
 66
66 -
 67
67 -
 68
68 -
 69
69 -
 70
70 -
71
-
72
-
73
-
74
-
75
-
76
-
77
-
78
-
79
-
80
-
81
-
82
-
83
-
84
-
85
-
86
-
87
-
88
-
89
-
90
-
91
-
92
-
93
-
94
-
95
-
96
-
97
-
98
-
99
-
100
-
101
-
102
-
103
-
104
-
105
-
106
-
107
-
108
-
109
-
110
-
111
-
112
-
113
-
114
-
115
-
116
-
117
-
118
-
119
-
120
-
121
-
122
-
123
-
124
-
125
-
126
-
127
-
128
-
129
-
130
-
131
-
132
-
133
-
134
-
135
-
136
-
137
-
138
-
139
-
140
-
141
-
142
-
143
-
144
-
145
-
146
-
147
-
148
-
149
-
150
-
151
-
152
-
153
-
154
-
155
-
156
-
157
-
158
-
159
-
160
-
161
-
162
-
163
-
164
-
165
-
166
-
167
-
168
-
169
-
170
-
171
-
172
-
173
-
174
-
175
-
176
-
177
-
178
-
179
-
180
-
181
-
182
-
183
-
184
-
185
-
186
-
187
-
188
-
189
-
190
-
191
-
192
-
193
-
194
-
195
-
196
-
197
-
198
-
199
-
200
-
201
-
202
-
203
-
204
-
205
-
206
-
207
-
208
-
209
-
210
-
211
-
212
-
213
-
214
-
215
 |
 |

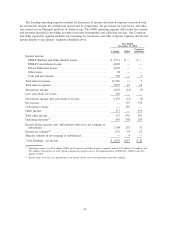
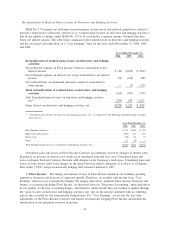
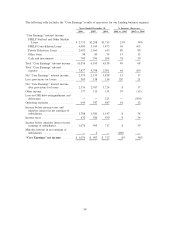
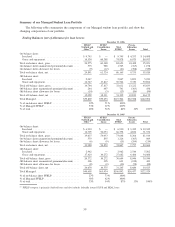
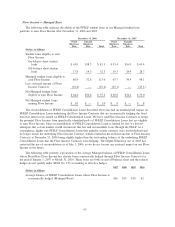
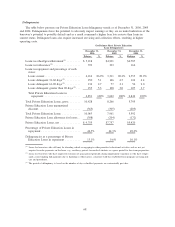
Summary of our Managed Student Loan Portfolio
The following tables summarize the components of our Managed student loan portfolio and show the
changing composition of our portfolio.
Ending Balances (net of allowance for loan losses):
FFELP
Stafford and
Other
(1)
FFELP
Consolidation
Loans
Total
FFELP
Private
Education
Loans Total
December 31, 2006
On-balance sheet:
In-school . . . . . . . . . . . . . . . . . . . . . . . . . . . . . . . $ 9,745 $ — $ 9,745 $ 4,353 $ 14,098
Grace and repayment . . . . . . . . . . . . . . . . . . . . . . . 14,530 60,348 74,878 6,075 80,953
Total on-balance sheet, gross . . . . . . . . . . . . . . . . . . . 24,275 60,348 84,623 10,428 95,051
On-balance sheet unamortized premium/(discount) . . . . 575 988 1,563 (365) 1,198
On-balance sheet allowance for losses . . . . . . . . . . . . . (9) (12) (21) (308) (329)
Total on-balance sheet, net . . . . . . . . . . . . . . . . . . . . . 24,841 61,324 86,165 9,755 95,920
Off-balance sheet:
In-school . . . . . . . . . . . . . . . . . . . . . . . . . . . . . . . 2,047 — 2,047 3,892 5,939
Grace and repayment . . . . . . . . . . . . . . . . . . . . . . . 12,747 17,817 30,564 9,330 39,894
Total off-balance sheet, gross . . . . . . . . . . . . . . . . . . . 14,794 17,817 32,611 13,222 45,833
Off-balance sheet unamortized premium/(discount) . . . . 244 497 741 (303) 438
Off-balance sheet allowance for losses . . . . . . . . . . . . (10) (3) (13) (86) (99)
Total off-balance sheet, net . . . . . . . . . . . . . . . . . . . . 15,028 18,311 33,339 12,833 46,172
Total Managed . . . . . . . . . . . . . . . . . . . . . . . . . . . . . $39,869 $79,635 $119,504 $22,588 $142,092
% of on-balance sheet FFELP. . . . . . . . . . . . . . . . . . . 29% 71% 100%
% of Managed FFELP . . . . . . . . . . . . . . . . . . . . . . . . 33% 67% 100%
% of total . . . . . . . . . . . . . . . . . . . . . . . . . . . . . . . . 28% 56% 84% 16% 100%
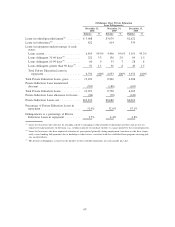
FFELP
Stafford and
Other
(1)
FFELP
Consolidation
Loans
Total
FFELP
Private
Education
Loans Total
December 31, 2005
On-balance sheet:
In-school . . . . . . . . . . . . . . . . . . . . . . . . . . . . . . . $ 6,910 $ — $ 6,910 $ 3,432 $ 10,342
Grace and repayment . . . . . . . . . . . . . . . . . . . . . . . 12,705 54,033 66,738 4,834 71,572
Total on-balance sheet, gross . . . . . . . . . . . . . . . . . . . 19,615 54,033 73,648 8,266 81,914
On-balance sheet unamortized premium/(discount) . . . . 379 835 1,214 (305) 909
On-balance sheet allowance for losses . . . . . . . . . . . . . (6) (9) (15) (204) (219)
Total on-balance sheet, net . . . . . . . . . . . . . . . . . . . . . 19,988 54,859 74,847 7,757 82,604
Off-balance sheet:
In-school . . . . . . . . . . . . . . . . . . . . . . . . . . . . . . . 2,962 — 2,962 2,540 5,502
Grace and repayment . . . . . . . . . . . . . . . . . . . . . . . 17,410 10,272 27,682 6,406 34,088
Total off-balance sheet, gross . . . . . . . . . . . . . . . . . . . 20,372 10,272 30,644 8,946 39,590
Off-balance sheet unamortized premium/(discount) . . . . 306 305 611 (188) 423
Off-balance sheet allowance for losses . . . . . . . . . . . . (8) (2) (10) (78) (88)
Total off-balance sheet, net . . . . . . . . . . . . . . . . . . . . 20,670 10,575 31,245 8,680 39,925
Total Managed . . . . . . . . . . . . . . . . . . . . . . . . . . . . . $40,658 $65,434 $106,092 $16,437 $122,529
% of on-balance sheet FFELP. . . . . . . . . . . . . . . . . . . 27% 73% 100%
% of Managed FFELP . . . . . . . . . . . . . . . . . . . . . . . . 38% 62% 100%
% of total . . . . . . . . . . . . . . . . . . . . . . . . . . . . . . . . 33% 54% 87% 13% 100%
(1)
FFELP category is primarily Stafford loans and also includes federally insured PLUS and HEAL loans.
59