Sallie Mae 2006 Annual Report Download - page 145
Download and view the complete annual report
Please find page 145 of the 2006 Sallie Mae annual report below. You can navigate through the pages in the report by either clicking on the pages listed below, or by using the keyword search tool below to find specific information within the annual report.-
 1
1 -
2
-
3
-
4
-
5
-
6
-
7
-
8
-
9
-
10
-
11
-
12
-
13
-
14
-
15
-
16
-
17
-
18
-
19
-
20
-
21
-
22
-
23
-
24
-
25
-
26
-
27
-
28
-
29
-
30
-
31
-
32
-
33
-
34
-
35
-
36
-
37
-
38
-
39
-
40
-
41
-
42
-
43
-
44
-
45
-
46
-
47
-
48
-
49
-
50
-
51
-
52
-
53
-
54
-
55
-
56
-
57
-
58
-
59
-
60
-
61
-
62
-
63
-
64
-
65
-
66
-
67
-
68
-
69
-
70
-
71
-
72
-
73
-
74
-
75
-
76
-
77
-
78
-
79
-
80
-
81
-
82
-
83
-
84
-
85
-
86
-
87
-
88
-
89
-
90
-
91
-
92
-
93
-
94
-
95
-
96
-
97
-
98
-
99
-
100
-
101
-
102
-
103
-
104
-
105
-
106
-
107
-
108
-
109
-
110
-
111
-
112
-
113
-
114
-
115
-
116
-
117
-
118
-
119
-
120
-
121
-
122
-
123
-
124
-
125
-
126
-
127
-
128
-
129
-
130
-
131
-
132
-
133
-
134
-
 135
135 -
 136
136 -
 137
137 -
 138
138 -
 139
139 -
 140
140 -
 141
141 -
 142
142 -
 143
143 -
 144
144 -
 145
145 -
 146
146 -
 147
147 -
 148
148 -
 149
149 -
 150
150 -
 151
151 -
 152
152 -
 153
153 -
 154
154 -
 155
155 -
156
-
157
-
158
-
159
-
160
-
161
-
162
-
163
-
164
-
165
-
166
-
167
-
168
-
169
-
170
-
171
-
172
-
173
-
174
-
175
-
176
-
177
-
178
-
179
-
180
-
181
-
182
-
183
-
184
-
185
-
186
-
187
-
188
-
189
-
190
-
191
-
192
-
193
-
194
-
195
-
196
-
197
-
198
-
199
-
200
-
201
-
202
-
203
-
204
-
205
-
206
-
207
-
208
-
209
-
210
-
211
-
212
-
213
-
214
-
215
 |
 |

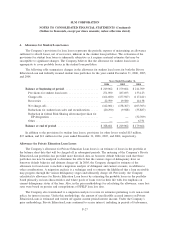
3. Student Loans (Continued)
borrowers that need more time or experience other hardships, the Company permits additional delays in
payment or partial payments (both referred to as forbearances) when it believes additional time will improve
the borrower’s ability to repay the loan. Forbearance is also granted to borrowers who may experience
temporary hardship after entering repayment, when the Company believes that it will increase the likelihood
of ultimate collection of the loan.
Forbearance does not grant any reduction in the total repayment obligation (principal or interest) but does
allow for the temporary cessation of borrower payments (on a prospective and/or retroactive basis) or a
reduction in monthly payments for an agreed period of time. The forbearance period extends the original term
of the loan. While the loan is in forbearance, interest continues to accrue and is recorded in interest income in
the accompanying consolidated financial statements, and is capitalized as principal upon the loan re-entering
repayment status. Loans exiting forbearance into repayment status are considered current regardless of their
previous delinquency status.
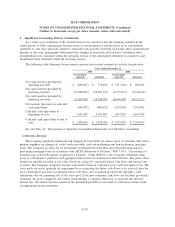
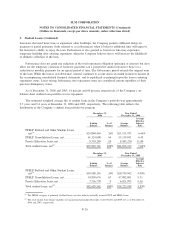
As of December 31, 2006 and 2005, 61 percent and 60 percent, respectively, of the Company’s on-
balance sheet student loan portfolio was in repayment.
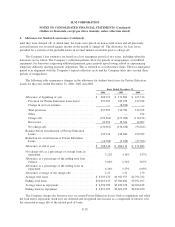
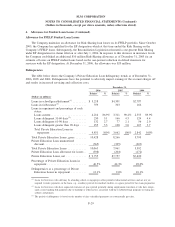
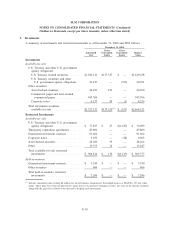
The estimated weighted average life of student loans in the Company’s portfolio was approximately
9.7 years and 9.4 years at December 31, 2006 and 2005, respectively. The following table reflects the
distribution of the Company’s student loan portfolio by program.
Ending
Balance
%of
Balance
Average
Balance
Average
Effective
Interest
Rate
December 31,
2006
Year Ended
December 31, 2006
FFELP Stafford and Other Student Loans,
net
(1)
............................... $24,840,464 26% $21,151,871 6.66%
FFELP Consolidation Loans, net ............. 61,324,008 64 55,119,011 6.43
Private Education loans, net ................ 9,755,289 10 8,585,270 11.90
Total student loans, net
(2)
.................. $95,919,761 100% $84,856,152 7.04%
Ending
Balance
%of
Balance
Average
Balance
Average
Effective
Interest
Rate
December 31,
2005
Year Ended
December 31, 2005
FFELP Stafford and Other Student Loans,
net
(1)
............................... $19,988,116 24% $20,719,942 4.90%
FFELP Consolidation Loans, net ............. 54,858,676 67 47,082,001 5.31
Private Education loans, net ................ 7,756,770 9 6,921,975 9.16
Total student loans, net
(2)
.................. $82,603,562 100% $74,723,918 5.55%
(1)
The FFELP category is primarily Stafford loans, but also includes federally insured PLUS and HEAL loans.
(2)
The total student loan balance includes net unamortized premiums/discounts of $1,198,404 and $909,417 as of December 31,
2006 and 2005, respectively.
F-26
SLM CORPORATION
NOTES TO CONSOLIDATED FINANCIAL STATEMENTS (Continued)
(Dollars in thousands, except per share amounts, unless otherwise stated)