Sallie Mae 2006 Annual Report Download - page 124
Download and view the complete annual report
Please find page 124 of the 2006 Sallie Mae annual report below. You can navigate through the pages in the report by either clicking on the pages listed below, or by using the keyword search tool below to find specific information within the annual report.-
 1
1 -
2
-
3
-
4
-
5
-
6
-
7
-
8
-
9
-
10
-
11
-
12
-
13
-
14
-
15
-
16
-
17
-
18
-
19
-
20
-
21
-
22
-
23
-
24
-
25
-
26
-
27
-
28
-
29
-
30
-
31
-
32
-
33
-
34
-
35
-
36
-
37
-
38
-
39
-
40
-
41
-
42
-
43
-
44
-
45
-
46
-
47
-
48
-
49
-
50
-
51
-
52
-
53
-
54
-
55
-
56
-
57
-
58
-
59
-
60
-
61
-
62
-
63
-
64
-
65
-
66
-
67
-
68
-
69
-
70
-
71
-
72
-
73
-
74
-
75
-
76
-
77
-
78
-
79
-
80
-
81
-
82
-
83
-
84
-
85
-
86
-
87
-
88
-
89
-
90
-
91
-
92
-
93
-
94
-
95
-
96
-
97
-
98
-
99
-
100
-
101
-
102
-
103
-
104
-
105
-
106
-
107
-
108
-
109
-
110
-
111
-
112
-
113
-
 114
114 -
 115
115 -
 116
116 -
 117
117 -
 118
118 -
 119
119 -
 120
120 -
 121
121 -
 122
122 -
 123
123 -
 124
124 -
 125
125 -
 126
126 -
 127
127 -
 128
128 -
 129
129 -
 130
130 -
 131
131 -
 132
132 -
 133
133 -
 134
134 -
135
-
136
-
137
-
138
-
139
-
140
-
141
-
142
-
143
-
144
-
145
-
146
-
147
-
148
-
149
-
150
-
151
-
152
-
153
-
154
-
155
-
156
-
157
-
158
-
159
-
160
-
161
-
162
-
163
-
164
-
165
-
166
-
167
-
168
-
169
-
170
-
171
-
172
-
173
-
174
-
175
-
176
-
177
-
178
-
179
-
180
-
181
-
182
-
183
-
184
-
185
-
186
-
187
-
188
-
189
-
190
-
191
-
192
-
193
-
194
-
195
-
196
-
197
-
198
-
199
-
200
-
201
-
202
-
203
-
204
-
205
-
206
-
207
-
208
-
209
-
210
-
211
-
212
-
213
-
214
-
215
 |
 |

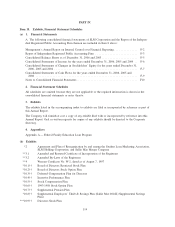
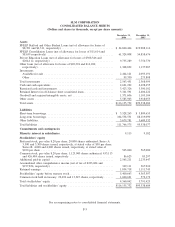
SLM CORPORATION
CONSOLIDATED BALANCE SHEETS
(Dollars and shares in thousands, except per share amounts)
December 31,
2006
December 31,
2005
Assets
FFELP Stafford and Other Student Loans (net of allowance for losses of
$8,701 and $6,311, respectively) ................................. $ 24,840,464 $19,988,116
FFELP Consolidation Loans (net of allowance for losses of $11,614 and
$8,639 respectively) .......................................... 61,324,008 54,858,676
Private Education Loans (net of allowance for losses of $308,346 and
$204,112, respectively) ........................................ 9,755,289 7,756,770
Other loans (net of allowance for losses of $20,394 and $16,180,
respectively) . . . ............................................. 1,308,832 1,137,987
Investments
Available-for-sale ............................................ 2,464,121 2,095,191
Other ..................................................... 99,330 273,808
Total investments . ............................................. 2,563,451 2,368,999
Cash and cash equivalents ........................................ 2,621,222 2,498,655
Restricted cash and investments.................................... 3,423,326 3,300,102
Retained Interest in off-balance sheet securitized loans................... 3,341,591 2,406,222
Goodwill and acquired intangible assets, net .......................... 1,371,606 1,105,104
Other assets .................................................. 5,585,943 3,918,053
Total assets ................................................... $116,135,732 $99,338,684
Liabilities
Short-term borrowings........................................... $ 3,528,263 $ 3,809,655
Long-term borrowings........................................... 104,558,531 88,119,090
Other liabilities . . . ............................................. 3,679,781 3,609,332
Total liabilities . . . ............................................. 111,766,575 95,538,077
Commitments and contingencies
Minority interest in subsidiaries .................................. 9,115 9,182
Stockholders’ equity
Preferred stock, par value $.20 per share, 20,000 shares authorized; Series A:
3,300 and 3,300 shares issued, respectively, at stated value of $50 per share;
Series B: 4,000 and 4,000 shares issued, respectively, at stated value of
$100 per share . ............................................. 565,000 565,000
Common stock, par value $.20 per share, 1,125,000 shares authorized: 433,113
and 426,484 shares issued, respectively ............................ 86,623 85,297
Additional paid-in capital ........................................ 2,565,211 2,233,647
Accumulated other comprehensive income (net of tax of $183,684 and
$197,834, respectively) ........................................ 349,111 367,910
Retained earnings . ............................................. 1,834,718 1,111,743
Stockholders’ equity before treasury stock ............................ 5,400,663 4,363,597
Common stock held in treasury: 22,496 and 13,347 shares, respectively ...... 1,040,621 572,172
Total stockholders’ equity ........................................ 4,360,042 3,791,425
Total liabilities and stockholders’ equity ............................. $116,135,732 $99,338,684
See accompanying notes to consolidated financial statements.
F-5