Sallie Mae 2006 Annual Report Download - page 105
Download and view the complete annual report
Please find page 105 of the 2006 Sallie Mae annual report below. You can navigate through the pages in the report by either clicking on the pages listed below, or by using the keyword search tool below to find specific information within the annual report.-
 1
1 -
2
-
3
-
4
-
5
-
6
-
7
-
8
-
9
-
10
-
11
-
12
-
13
-
14
-
15
-
16
-
17
-
18
-
19
-
20
-
21
-
22
-
23
-
24
-
25
-
26
-
27
-
28
-
29
-
30
-
31
-
32
-
33
-
34
-
35
-
36
-
37
-
38
-
39
-
40
-
41
-
42
-
43
-
44
-
45
-
46
-
47
-
48
-
49
-
50
-
51
-
52
-
53
-
54
-
55
-
56
-
57
-
58
-
59
-
60
-
61
-
62
-
63
-
64
-
65
-
66
-
67
-
68
-
69
-
70
-
71
-
72
-
73
-
74
-
75
-
76
-
77
-
78
-
79
-
80
-
81
-
82
-
83
-
84
-
85
-
86
-
87
-
88
-
89
-
90
-
91
-
92
-
93
-
94
-
 95
95 -
 96
96 -
 97
97 -
 98
98 -
 99
99 -
 100
100 -
 101
101 -
 102
102 -
 103
103 -
 104
104 -
 105
105 -
 106
106 -
 107
107 -
 108
108 -
 109
109 -
 110
110 -
 111
111 -
 112
112 -
 113
113 -
 114
114 -
 115
115 -
116
-
117
-
118
-
119
-
120
-
121
-
122
-
123
-
124
-
125
-
126
-
127
-
128
-
129
-
130
-
131
-
132
-
133
-
134
-
135
-
136
-
137
-
138
-
139
-
140
-
141
-
142
-
143
-
144
-
145
-
146
-
147
-
148
-
149
-
150
-
151
-
152
-
153
-
154
-
155
-
156
-
157
-
158
-
159
-
160
-
161
-
162
-
163
-
164
-
165
-
166
-
167
-
168
-
169
-
170
-
171
-
172
-
173
-
174
-
175
-
176
-
177
-
178
-
179
-
180
-
181
-
182
-
183
-
184
-
185
-
186
-
187
-
188
-
189
-
190
-
191
-
192
-
193
-
194
-
195
-
196
-
197
-
198
-
199
-
200
-
201
-
202
-
203
-
204
-
205
-
206
-
207
-
208
-
209
-
210
-
211
-
212
-
213
-
214
-
215
 |
 |

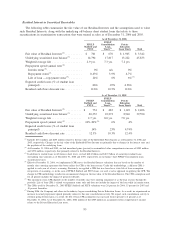
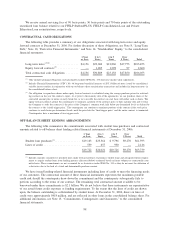
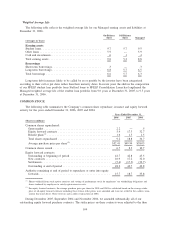
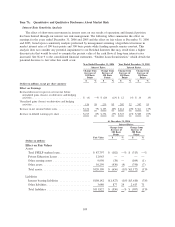
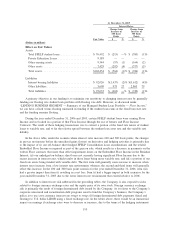
Weighted Average Life
The following table reflects the weighted average life for our Managed earning assets and liabilities at
December 31, 2006.
On-Balance
Sheet
Off-Balance
Sheet Managed
(Averages in Years)
Earning assets
Student loans...................................... 9.7 5.7 9.5
Other loans ....................................... 5.9 — 5.9
Cash and investments................................ .6 .1 .4
Total earning assets ................................. 9.0 5.2 8.8
Borrowings
Short-term borrowings ............................... .3 — .3
Long-term borrowings ............................... 6.8 5.7 6.5
Total borrowings ................................... 6.6 5.7 6.3
Long-term debt issuances likely to be called by us or putable by the investor have been categorized
according to their call or put dates rather than their maturity dates. In recent years the shift in the composition
of our FFELP student loan portfolio from Stafford loans to FFELP Consolidation Loans has lengthened the
Managed weighted average life of the student loan portfolio from 9.0 years at December 31, 2005, to 9.5 years
at December 31, 2006.
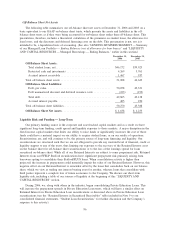
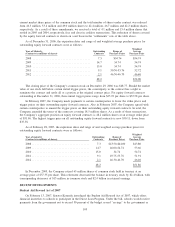
COMMON STOCK
The following table summarizes the Company’s common share repurchase, issuance and equity forward
activity for the years ended December 31, 2006, 2005 and 2004.
2006 2005 2004
Years Ended December 31,
(Shares in millions)
Common shares repurchased:
Open market .......................................... 2.2 — .5
Equity forward contracts ................................. 5.4 17.3 32.7
Benefit plans
(1)
........................................ 1.6 1.5 1.5
Total shares repurchased ................................. 9.2 18.8 34.7
Average purchase price per share
(2)
......................... $52.41 $49.94 $38.03
Common shares issued .................................... 6.7 8.3 10.7
Equity forward contracts:
Outstanding at beginning of period ......................... 42.7 42.8 43.5
New contracts ......................................... 10.9 17.2 32.0
Settlements ........................................... (5.4) (17.3) (32.7)
Outstanding at end of period .............................. 48.2 42.7 42.8
Authority remaining at end of period to repurchase or enter into equity
forwards ............................................. 15.7 18.7 35.8
(1)
Shares withheld from stock option exercises and vesting of performance stock for employees’ tax withholding obligations and
shares tendered by employees to satisfy option exercise costs.
(2)
For equity forward contracts, the average purchase price per share for 2005 and 2004 is calculated based on the average strike
price of all equity forward contracts including those whose strike prices were amended and were net settled in the cashless trans-
actions discussed above. There were no such cashless transactions in 2006.
During December 2005, September 2004 and November 2004, we amended substantially all of our
outstanding equity forward purchase contracts. The strike prices on these contracts were adjusted to the then
104