Sallie Mae 2006 Annual Report Download - page 17
Download and view the complete annual report
Please find page 17 of the 2006 Sallie Mae annual report below. You can navigate through the pages in the report by either clicking on the pages listed below, or by using the keyword search tool below to find specific information within the annual report.-
 1
1 -
2
-
3
-
4
-
5
-
6
-
 7
7 -
 8
8 -
 9
9 -
 10
10 -
 11
11 -
 12
12 -
 13
13 -
 14
14 -
 15
15 -
 16
16 -
 17
17 -
 18
18 -
 19
19 -
 20
20 -
 21
21 -
 22
22 -
 23
23 -
 24
24 -
 25
25 -
 26
26 -
 27
27 -
28
-
29
-
30
-
31
-
32
-
33
-
34
-
35
-
36
-
37
-
38
-
39
-
40
-
41
-
42
-
43
-
44
-
45
-
46
-
47
-
48
-
49
-
50
-
51
-
52
-
53
-
54
-
55
-
56
-
57
-
58
-
59
-
60
-
61
-
62
-
63
-
64
-
65
-
66
-
67
-
68
-
69
-
70
-
71
-
72
-
73
-
74
-
75
-
76
-
77
-
78
-
79
-
80
-
81
-
82
-
83
-
84
-
85
-
86
-
87
-
88
-
89
-
90
-
91
-
92
-
93
-
94
-
95
-
96
-
97
-
98
-
99
-
100
-
101
-
102
-
103
-
104
-
105
-
106
-
107
-
108
-
109
-
110
-
111
-
112
-
113
-
114
-
115
-
116
-
117
-
118
-
119
-
120
-
121
-
122
-
123
-
124
-
125
-
126
-
127
-
128
-
129
-
130
-
131
-
132
-
133
-
134
-
135
-
136
-
137
-
138
-
139
-
140
-
141
-
142
-
143
-
144
-
145
-
146
-
147
-
148
-
149
-
150
-
151
-
152
-
153
-
154
-
155
-
156
-
157
-
158
-
159
-
160
-
161
-
162
-
163
-
164
-
165
-
166
-
167
-
168
-
169
-
170
-
171
-
172
-
173
-
174
-
175
-
176
-
177
-
178
-
179
-
180
-
181
-
182
-
183
-
184
-
185
-
186
-
187
-
188
-
189
-
190
-
191
-
192
-
193
-
194
-
195
-
196
-
197
-
198
-
199
-
200
-
201
-
202
-
203
-
204
-
205
-
206
-
207
-
208
-
209
-
210
-
211
-
212
-
213
-
214
-
215
 |
 |

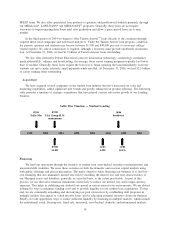
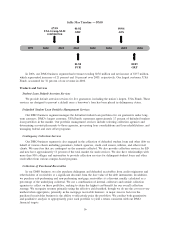
Sallie Mae Timeline — DMO
01/02
PCR
08/05
GRP
07/99
USA Group-SLM
combination
01/02
GRC
09/04
AFS
1999 2000 2001 2002 2003 2004 2005 2006
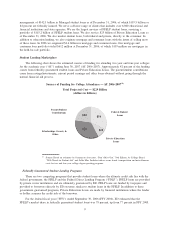
In 2006, our DMO business segment had revenues totaling $636 million and net income of $157 million,
which represented increases of 21 percent and 16 percent over 2005, respectively. Our largest customer, USA
Funds, accounted for 32 percent of our revenue in 2006.
Products and Services
Student Loan Default Aversion Services
We provide default aversion services for five guarantors, including the nation’s largest, USA Funds. These
services are designed to prevent a default once a borrower’s loan has been placed in delinquency status.
Defaulted Student Loan Portfolio Management Services
Our DMO business segment manages the defaulted student loan portfolios for six guarantors under long-
term contracts. DMO’s largest customer, USA Funds, represents approximately 17 percent of defaulted student
loan portfolios in the market. Our portfolio management services include selecting collection agencies and
determining account placements to those agencies, processing loan consolidations and loan rehabilitations, and
managing federal and state offset programs.
Contingency Collection Services
Our DMO business segment is also engaged in the collection of defaulted student loans and other debt on
behalf of various clients including guarantors, federal agencies, credit card issuers, utilities, and other retail
clients. We earn fees that are contingent on the amounts collected. We also provide collection services for ED
and now have approximately 11 percent of the total market for such services. We also have relationships with
more than 900 colleges and universities to provide collection services for delinquent student loans and other
receivables from various campus-based programs.
Collection of Purchased Receivables
In our DMO business, we also purchase delinquent and defaulted receivables from credit originators and
other holders of receivables at a significant discount from the face value of the debt instruments. In addition,
we purchase sub-performing and non-performing mortgage receivables at a discount usually calculated as a
percentage of the underlying collateral. We use a combination of internal collectors and outside collection
agencies to collect on these portfolios, seeking to attain the highest cost/benefit for our overall collection
strategy. We recognize revenue primarily using the effective yield method, though we do use the cost recovery
method when appropriate, primarily in the mortgage receivable business. A major success factor in the
purchased receivables business is the ability to effectively price the portfolios. We conduct both quantitative
and qualitative analysis to appropriately price each portfolio to yield a return consistent with our DMO
financial targets.
16