Sallie Mae 2006 Annual Report Download - page 44
Download and view the complete annual report
Please find page 44 of the 2006 Sallie Mae annual report below. You can navigate through the pages in the report by either clicking on the pages listed below, or by using the keyword search tool below to find specific information within the annual report.-
 1
1 -
2
-
3
-
4
-
5
-
6
-
7
-
8
-
9
-
10
-
11
-
12
-
13
-
14
-
15
-
16
-
17
-
18
-
19
-
20
-
21
-
22
-
23
-
24
-
25
-
26
-
27
-
28
-
29
-
30
-
31
-
32
-
33
-
 34
34 -
 35
35 -
 36
36 -
 37
37 -
 38
38 -
 39
39 -
 40
40 -
 41
41 -
 42
42 -
 43
43 -
 44
44 -
 45
45 -
 46
46 -
 47
47 -
 48
48 -
 49
49 -
 50
50 -
 51
51 -
 52
52 -
 53
53 -
 54
54 -
55
-
56
-
57
-
58
-
59
-
60
-
61
-
62
-
63
-
64
-
65
-
66
-
67
-
68
-
69
-
70
-
71
-
72
-
73
-
74
-
75
-
76
-
77
-
78
-
79
-
80
-
81
-
82
-
83
-
84
-
85
-
86
-
87
-
88
-
89
-
90
-
91
-
92
-
93
-
94
-
95
-
96
-
97
-
98
-
99
-
100
-
101
-
102
-
103
-
104
-
105
-
106
-
107
-
108
-
109
-
110
-
111
-
112
-
113
-
114
-
115
-
116
-
117
-
118
-
119
-
120
-
121
-
122
-
123
-
124
-
125
-
126
-
127
-
128
-
129
-
130
-
131
-
132
-
133
-
134
-
135
-
136
-
137
-
138
-
139
-
140
-
141
-
142
-
143
-
144
-
145
-
146
-
147
-
148
-
149
-
150
-
151
-
152
-
153
-
154
-
155
-
156
-
157
-
158
-
159
-
160
-
161
-
162
-
163
-
164
-
165
-
166
-
167
-
168
-
169
-
170
-
171
-
172
-
173
-
174
-
175
-
176
-
177
-
178
-
179
-
180
-
181
-
182
-
183
-
184
-
185
-
186
-
187
-
188
-
189
-
190
-
191
-
192
-
193
-
194
-
195
-
196
-
197
-
198
-
199
-
200
-
201
-
202
-
203
-
204
-
205
-
206
-
207
-
208
-
209
-
210
-
211
-
212
-
213
-
214
-
215
 |
 |

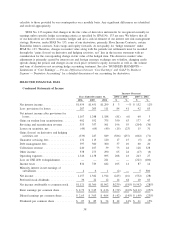
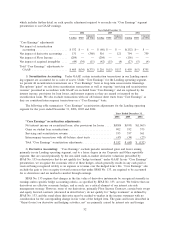
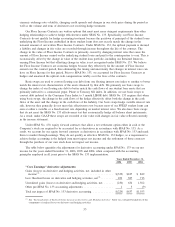
Rate/Volume Analysis
The following rate/volume analysis shows the relative contribution of changes in interest rates and asset
volumes.
Increase
(Decrease) Rate Volume
Increase
(Decrease)
Attributable to
Change in
2006 vs. 2005
Interest income ......................................... $2,065 $1,367 $698
Interest expense ........................................ 2,064 1,589 475
Net interest income...................................... $ 1 $(222) $223
2005 vs. 2004
Interest income ......................................... $1,774 $1,008 $766
Interest expense ........................................ 1,625 1,325 300
Net interest income...................................... $ 149 $(317) $466
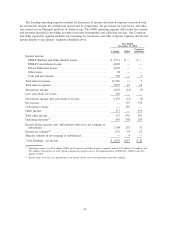
The decrease in the net interest margin in 2006 versus 2005 and 2005 versus 2004 is primarily due to
fluctuations in the student loan spread as discussed under “Student Loans — Student Loan Spread Analysis —
On-Balance Sheet.” The net interest margin was also negatively impacted by the increase in lower yielding
cash and investments being held as collateral for on-balance sheet securitization trusts and by the higher
average balance of non-interest earning assets. In 2004, the net interest margin was negatively impacted by the
higher average balances of lower yielding short-term investments which were being built up during 2004 as
additional liquidity in anticipation of the GSE Wind-Down.
Student Loans
For both federally insured and Private Education Loans, we account for premiums paid, discounts
received and certain origination costs incurred on the origination and acquisition of student loans in
accordance with SFAS No. 91, “Accounting for Nonrefundable Fees and Costs Associated with Originating or
Acquiring Loans and Initial Direct Costs of Leases.” The unamortized portion of the premiums and discounts
is included in the carrying value of the student loan on the consolidated balance sheet. We recognize income
on our student loan portfolio based on the expected yield of the student loan after giving effect to the
amortization of purchase premiums and the accretion of student loan discounts, as well as interest rate
reductions and rebates expected to be earned through Borrower Benefits programs. Discounts on Private
Education Loans are deferred and accreted to income over the lives of the student loans. In the table below,
this accretion of discounts is netted with the amortization of the premiums.
Student Loan Spread
An important performance measure closely monitored by management is the student loan spread. The
student loan spread is the difference between the income earned on the student loan assets and the interest
paid on the debt funding those assets. A number of factors can affect the overall student loan spread such as:
• the mix of student loans in the portfolio, with FFELP Consolidation Loans having the lowest spread
and Private Education Loans having the highest spread;
• the premiums paid, borrower fees charged and capitalized costs incurred to acquire student loans which
impact the spread through subsequent amortization;
• the type and level of Borrower Benefits programs for which the student loans are eligible;
43