Sallie Mae 2006 Annual Report Download - page 199
Download and view the complete annual report
Please find page 199 of the 2006 Sallie Mae annual report below. You can navigate through the pages in the report by either clicking on the pages listed below, or by using the keyword search tool below to find specific information within the annual report.-
 1
1 -
2
-
3
-
4
-
5
-
6
-
7
-
8
-
9
-
10
-
11
-
12
-
13
-
14
-
15
-
16
-
17
-
18
-
19
-
20
-
21
-
22
-
23
-
24
-
25
-
26
-
27
-
28
-
29
-
30
-
31
-
32
-
33
-
34
-
35
-
36
-
37
-
38
-
39
-
40
-
41
-
42
-
43
-
44
-
45
-
46
-
47
-
48
-
49
-
50
-
51
-
52
-
53
-
54
-
55
-
56
-
57
-
58
-
59
-
60
-
61
-
62
-
63
-
64
-
65
-
66
-
67
-
68
-
69
-
70
-
71
-
72
-
73
-
74
-
75
-
76
-
77
-
78
-
79
-
80
-
81
-
82
-
83
-
84
-
85
-
86
-
87
-
88
-
89
-
90
-
91
-
92
-
93
-
94
-
95
-
96
-
97
-
98
-
99
-
100
-
101
-
102
-
103
-
104
-
105
-
106
-
107
-
108
-
109
-
110
-
111
-
112
-
113
-
114
-
115
-
116
-
117
-
118
-
119
-
120
-
121
-
122
-
123
-
124
-
125
-
126
-
127
-
128
-
129
-
130
-
131
-
132
-
133
-
134
-
135
-
136
-
137
-
138
-
139
-
140
-
141
-
142
-
143
-
144
-
145
-
146
-
147
-
148
-
149
-
150
-
151
-
152
-
153
-
154
-
155
-
156
-
157
-
158
-
159
-
160
-
161
-
162
-
163
-
164
-
165
-
166
-
167
-
168
-
169
-
170
-
171
-
172
-
173
-
174
-
175
-
176
-
177
-
178
-
179
-
180
-
181
-
182
-
183
-
184
-
185
-
186
-
187
-
188
-
 189
189 -
 190
190 -
 191
191 -
 192
192 -
 193
193 -
 194
194 -
 195
195 -
 196
196 -
 197
197 -
 198
198 -
 199
199 -
 200
200 -
 201
201 -
 202
202 -
 203
203 -
 204
204 -
 205
205 -
 206
206 -
 207
207 -
 208
208 -
 209
209 -
210
-
211
-
212
-
213
-
214
-
215
 |
 |

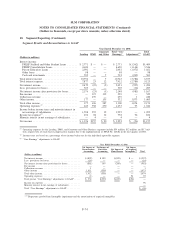
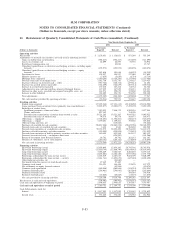
20. Quarterly Financial Information (unaudited)
First
Quarter
Second
Quarter
Third
Quarter
Fourth
Quarter
2006
Net interest income ............................ $387,521 $ 356,805 $ 337,821 $ 371,970
Less: provisions for losses ....................... 60,319 67,396 67,242 92,005
Net interest income after provisions for losses ......... 327,202 289,409 270,579 279,965
Gains (losses) on derivative and hedging activities, net . . (86,739) 122,719 (130,855) (244,521)
Other income ................................. 372,582 1,011,435 682,027 447,623
Operating expenses............................. 323,309 316,602 353,494 352,747
Income taxes ................................. 137,045 381,828 203,686 111,752
Minority interest in net earnings of subsidiaries ........ 1,090 1,355 1,099 463
Net income .................................. 151,601 723,778 263,472 18,105
Preferred stock dividends ........................ 8,301 8,787 9,221 9,258
Net income attributable to common stock ............ $143,300 $ 714,991 $ 254,251 $ 8,847
Basic earnings per common share .................. $ .35 $ 1.74 $ .62 $ .02
Diluted earnings per common share ................ $ .34 $ 1.52 $ .60 $ .02
First
Quarter
Second
Quarter
Third
Quarter
Fourth
Quarter
2005
Net interest income .............................. $346,760 $ 329,788 $384,764 $390,133
Less: provisions for losses ......................... 46,523 78,948 12,217 65,318
Net interest income after provisions for losses ........... 300,237 250,840 372,547 324,815
Gains (losses) on derivative and hedging activities, net . . . . (34,251) (105,940) 316,469 70,270
Other income ................................... 408,349 617,836 185,145 549,474
Operating expenses............................... 262,291 287,413 291,961 296,663
Income taxes ................................... 186,466 176,573 149,821 215,907
Minority interest in net earnings of subsidiaries .......... 2,194 2,235 1,029 954
Net income .................................... 223,384 296,515 431,350 431,035
Preferred stock dividends .......................... 2,875 3,908 7,288 7,832
Net income attributable to common stock .............. $220,509 $ 292,607 $424,062 $423,203
Basic earnings per common share .................... $ .52 $ .70 $ 1.02 $ 1.02
Diluted earnings per common share .................. $ .49 $ .66 $ .95 $ .96
F-80
SLM CORPORATION
NOTES TO CONSOLIDATED FINANCIAL STATEMENTS (Continued)
(Dollars in thousands, except per share amounts, unless otherwise stated)