Sallie Mae 2006 Annual Report Download - page 63
Download and view the complete annual report
Please find page 63 of the 2006 Sallie Mae annual report below. You can navigate through the pages in the report by either clicking on the pages listed below, or by using the keyword search tool below to find specific information within the annual report.-
 1
1 -
2
-
3
-
4
-
5
-
6
-
7
-
8
-
9
-
10
-
11
-
12
-
13
-
14
-
15
-
16
-
17
-
18
-
19
-
20
-
21
-
22
-
23
-
24
-
25
-
26
-
27
-
28
-
29
-
30
-
31
-
32
-
33
-
34
-
35
-
36
-
37
-
38
-
39
-
40
-
41
-
42
-
43
-
44
-
45
-
46
-
47
-
48
-
49
-
50
-
51
-
52
-
 53
53 -
 54
54 -
 55
55 -
 56
56 -
 57
57 -
 58
58 -
 59
59 -
 60
60 -
 61
61 -
 62
62 -
 63
63 -
 64
64 -
 65
65 -
 66
66 -
 67
67 -
 68
68 -
 69
69 -
 70
70 -
 71
71 -
 72
72 -
 73
73 -
74
-
75
-
76
-
77
-
78
-
79
-
80
-
81
-
82
-
83
-
84
-
85
-
86
-
87
-
88
-
89
-
90
-
91
-
92
-
93
-
94
-
95
-
96
-
97
-
98
-
99
-
100
-
101
-
102
-
103
-
104
-
105
-
106
-
107
-
108
-
109
-
110
-
111
-
112
-
113
-
114
-
115
-
116
-
117
-
118
-
119
-
120
-
121
-
122
-
123
-
124
-
125
-
126
-
127
-
128
-
129
-
130
-
131
-
132
-
133
-
134
-
135
-
136
-
137
-
138
-
139
-
140
-
141
-
142
-
143
-
144
-
145
-
146
-
147
-
148
-
149
-
150
-
151
-
152
-
153
-
154
-
155
-
156
-
157
-
158
-
159
-
160
-
161
-
162
-
163
-
164
-
165
-
166
-
167
-
168
-
169
-
170
-
171
-
172
-
173
-
174
-
175
-
176
-
177
-
178
-
179
-
180
-
181
-
182
-
183
-
184
-
185
-
186
-
187
-
188
-
189
-
190
-
191
-
192
-
193
-
194
-
195
-
196
-
197
-
198
-
199
-
200
-
201
-
202
-
203
-
204
-
205
-
206
-
207
-
208
-
209
-
210
-
211
-
212
-
213
-
214
-
215
 |
 |

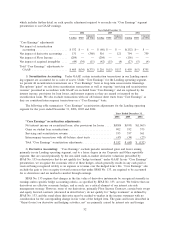
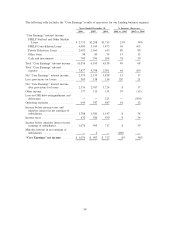
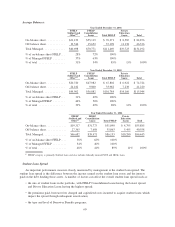
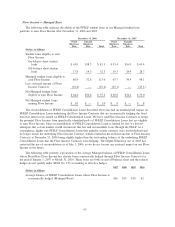
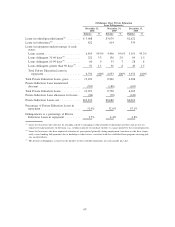
“Core Earnings” basis student loan spread includes the spread on loans that we have sold to securitization
trusts.
2006 2005 2004
Years ended December 31,
“Core Earnings” basis student loan yield................... 8.09% 6.32% 4.59%
Consolidation Loan Rebate Fees ......................... (.55) (.50) (.42)
Offset Fees ........................................ — — (.02)
Borrower Benefits ................................... (.09) (.07) (.08)
Premium and discount amortization . . . ................... (.16) (.17) (.13)
“Core Earnings” basis student loan net yield ................ 7.29 5.58 3.94
“Core Earnings” basis student loan cost of funds............. (5.45) (3.80) (2.06)
“Core Earnings” basis student loan spread
(1)
................ 1.84% 1.78% 1.88%
Average Balances
On-balance sheet student loans
(1)
........................ $ 84,173 $ 74,724 $55,885
Off-balance sheet student loans ......................... 46,336 41,220 40,558
Managed student loans ................................ $130,509 $115,944 $96,443
(1)
Excludes the impact of the Wholesale Consolidation Loan portfolio on the student loan spread and average balances for the year
ended December 31, 2006.
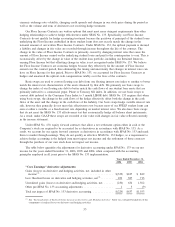
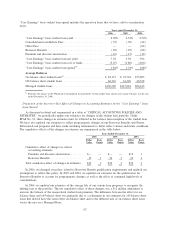
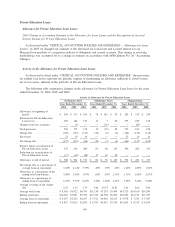
Discussion of the Year-over-Year Effect of Changes in Accounting Estimates on the “Core Earnings” basis
Loan Spread
As discussed in detail and summarized in a table at “CRITICAL ACCOUNTING POLICIES AND
ESTIMATES,” we periodically update our estimates for changes in the student loan portfolio. Under
SFAS No. 91, these changes in estimates must be reflected in the balance from inception of the student loan.
We have also updated our estimates to reflect programmatic changes in our Borrower Benefits and Private
Education Loan programs and have made modeling refinements to better reflect current and future conditions.
The cumulative effects of the changes in estimates are summarized in the table below:
Dollar
Value
Basis
Points
Dollar
Value
Basis
Points
Dollar
Value
Basis
Points
2006 2005 2004
Years Ended December 31,
Cumulative effect of changes in critical
accounting estimates:
Premium and discount amortization ........ $— — $— — $12 1
Borrower Benefits ..................... 15 1 34 3 22 2
Total cumulative effect of changes in estimates . . $15 1 $34 3 $34 3
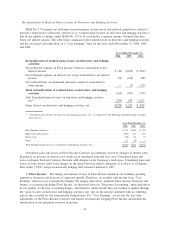
In 2006, we changed our policy related to Borrower Benefit qualification requirements and updated our
assumptions to reflect this policy. In 2005 and 2004, we updated our estimates for the qualification for
Borrower Benefits to account for programmatic changes as well as the effect of continued high levels of
consolidations.
In 2004, we updated our estimates of the average life of our various loan programs to recognize the
shifting mix of the portfolio. The net cumulative effect of these changes was a $12 million adjustment to
increase the balance of the unamortized student loan premium. The difference between the effect for on-
balance sheet and off-balance sheet was primarily due to a refinement in our estimates for off-balance sheet
loans that did not have the same effect on-balance sheet and to the different mix of on-balance sheet loans
versus the mix on a Managed Basis.
62