Sallie Mae 2006 Annual Report Download - page 170
Download and view the complete annual report
Please find page 170 of the 2006 Sallie Mae annual report below. You can navigate through the pages in the report by either clicking on the pages listed below, or by using the keyword search tool below to find specific information within the annual report.-
 1
1 -
2
-
3
-
4
-
5
-
6
-
7
-
8
-
9
-
10
-
11
-
12
-
13
-
14
-
15
-
16
-
17
-
18
-
19
-
20
-
21
-
22
-
23
-
24
-
25
-
26
-
27
-
28
-
29
-
30
-
31
-
32
-
33
-
34
-
35
-
36
-
37
-
38
-
39
-
40
-
41
-
42
-
43
-
44
-
45
-
46
-
47
-
48
-
49
-
50
-
51
-
52
-
53
-
54
-
55
-
56
-
57
-
58
-
59
-
60
-
61
-
62
-
63
-
64
-
65
-
66
-
67
-
68
-
69
-
70
-
71
-
72
-
73
-
74
-
75
-
76
-
77
-
78
-
79
-
80
-
81
-
82
-
83
-
84
-
85
-
86
-
87
-
88
-
89
-
90
-
91
-
92
-
93
-
94
-
95
-
96
-
97
-
98
-
99
-
100
-
101
-
102
-
103
-
104
-
105
-
106
-
107
-
108
-
109
-
110
-
111
-
112
-
113
-
114
-
115
-
116
-
117
-
118
-
119
-
120
-
121
-
122
-
123
-
124
-
125
-
126
-
127
-
128
-
129
-
130
-
131
-
132
-
133
-
134
-
135
-
136
-
137
-
138
-
139
-
140
-
141
-
142
-
143
-
144
-
145
-
146
-
147
-
148
-
149
-
150
-
151
-
152
-
153
-
154
-
155
-
156
-
157
-
158
-
159
-
 160
160 -
 161
161 -
 162
162 -
 163
163 -
 164
164 -
 165
165 -
 166
166 -
 167
167 -
 168
168 -
 169
169 -
 170
170 -
 171
171 -
 172
172 -
 173
173 -
 174
174 -
 175
175 -
 176
176 -
 177
177 -
 178
178 -
 179
179 -
 180
180 -
181
-
182
-
183
-
184
-
185
-
186
-
187
-
188
-
189
-
190
-
191
-
192
-
193
-
194
-
195
-
196
-
197
-
198
-
199
-
200
-
201
-
202
-
203
-
204
-
205
-
206
-
207
-
208
-
209
-
210
-
211
-
212
-
213
-
214
-
215
 |
 |
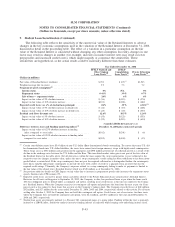
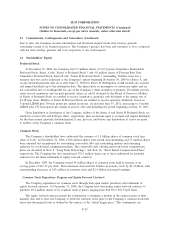
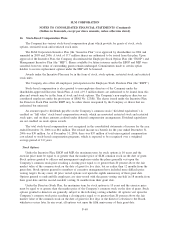
11. Acquisitions (Continued)
DMO business segment. Goodwill will be reviewed for impairment at least annually in accordance with
SFAS No. 142, as discussed further in Note 6, “Goodwill and Acquired Intangible Assets.”
Identifiable intangible assets at each respective acquisition date include AFS’s trade name, an indefinite
life intangible asset, with an aggregate fair value of approximately $15 million as of the acquisition dates and
definite life intangible assets with aggregate fair values of approximately $22 million as of the acquisition
dates, $20 million of which is attributed to customer relationships.
GRP/AG Holdings, LLC
On August 31, 2005, the Company acquired 100 percent controlling interest in GRP/AG Holdings, LLC
and its subsidiaries (collectively, “GRP”) for a purchase price of approximately $137 million including cash
consideration and certain acquisition costs. GRP engages in the acquisition and resolution of distressed
residential mortgage loans and foreclosed residential properties. In the third quarter of 2006, the Company
finalized its purchase price allocation for GRP, which resulted in an excess purchase price over the fair value
of net assets acquired, or goodwill, of $53 million.
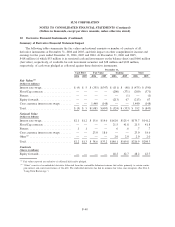
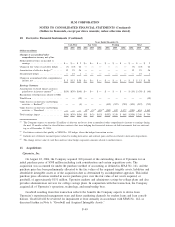
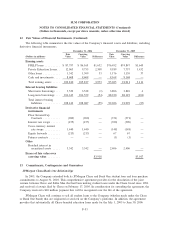
12. Fair Values of Financial Instruments
SFAS No. 107, “Disclosures about Fair Value of Financial Instruments,” requires the estimation of the
fair values of financial instruments. The following is a summary of the assumptions and methods used to
estimate those values.
Student Loans
For both FFELP loans and Private Education Loans, fair value was determined by modeling loan level
cash flows using stated terms of the assets and internally-developed assumptions to determine aggregate
portfolio yield, net present value and average life. The significant assumptions used to project cash flows are
prepayment speeds, default rates, and expected Borrower Benefits to be earned. In addition, the Floor Income
component of the Company’s FFELP loan portfolio is valued through discounted cash flow and option models
using both observable market inputs and internally developed inputs.
Other Loans
The fair values of warehousing and facilities financings were determined through standard bond pricing
models using observable market inputs adjusted for credit spreads. The fair values of consumer and mortgage
loans were determined by modeling cash flows aggregated by loan type using observable market inputs to
determine portfolio yield, net present value and average life.
Cash and Investments (Including “Restricted”)
For all cash and cash equivalents, carrying value approximated fair value. Investments in U.S. Treasury
securities, securities issued by U.S. government agencies, and corporate notes were valued using observable
market prices. U.S. Treasury-backed securities and all other investments were valued through standard bond
pricing models using observable market inputs adjusted for credit spreads.
F-51
SLM CORPORATION
NOTES TO CONSOLIDATED FINANCIAL STATEMENTS (Continued)
(Dollars in thousands, except per share amounts, unless otherwise stated)