Sallie Mae 2006 Annual Report Download - page 110
Download and view the complete annual report
Please find page 110 of the 2006 Sallie Mae annual report below. You can navigate through the pages in the report by either clicking on the pages listed below, or by using the keyword search tool below to find specific information within the annual report.-
 1
1 -
2
-
3
-
4
-
5
-
6
-
7
-
8
-
9
-
10
-
11
-
12
-
13
-
14
-
15
-
16
-
17
-
18
-
19
-
20
-
21
-
22
-
23
-
24
-
25
-
26
-
27
-
28
-
29
-
30
-
31
-
32
-
33
-
34
-
35
-
36
-
37
-
38
-
39
-
40
-
41
-
42
-
43
-
44
-
45
-
46
-
47
-
48
-
49
-
50
-
51
-
52
-
53
-
54
-
55
-
56
-
57
-
58
-
59
-
60
-
61
-
62
-
63
-
64
-
65
-
66
-
67
-
68
-
69
-
70
-
71
-
72
-
73
-
74
-
75
-
76
-
77
-
78
-
79
-
80
-
81
-
82
-
83
-
84
-
85
-
86
-
87
-
88
-
89
-
90
-
91
-
92
-
93
-
94
-
95
-
96
-
97
-
98
-
99
-
 100
100 -
 101
101 -
 102
102 -
 103
103 -
 104
104 -
 105
105 -
 106
106 -
 107
107 -
 108
108 -
 109
109 -
 110
110 -
 111
111 -
 112
112 -
 113
113 -
 114
114 -
 115
115 -
 116
116 -
 117
117 -
 118
118 -
 119
119 -
 120
120 -
121
-
122
-
123
-
124
-
125
-
126
-
127
-
128
-
129
-
130
-
131
-
132
-
133
-
134
-
135
-
136
-
137
-
138
-
139
-
140
-
141
-
142
-
143
-
144
-
145
-
146
-
147
-
148
-
149
-
150
-
151
-
152
-
153
-
154
-
155
-
156
-
157
-
158
-
159
-
160
-
161
-
162
-
163
-
164
-
165
-
166
-
167
-
168
-
169
-
170
-
171
-
172
-
173
-
174
-
175
-
176
-
177
-
178
-
179
-
180
-
181
-
182
-
183
-
184
-
185
-
186
-
187
-
188
-
189
-
190
-
191
-
192
-
193
-
194
-
195
-
196
-
197
-
198
-
199
-
200
-
201
-
202
-
203
-
204
-
205
-
206
-
207
-
208
-
209
-
210
-
211
-
212
-
213
-
214
-
215
 |
 |

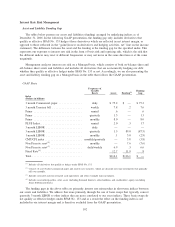
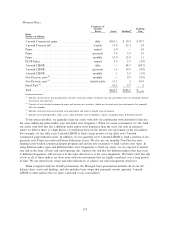
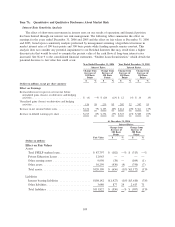
Item 7A. Quantitative and Qualitative Disclosures About Market Risk
Interest Rate Sensitivity Analysis
The effect of short-term movements in interest rates on our results of operations and financial position
has been limited through our interest rate risk management. The following tables summarize the effect on
earnings for the years ended December 31, 2006 and 2005 and the effect on fair values at December 31, 2006
and 2005, based upon a sensitivity analysis performed by management assuming a hypothetical increase in
market interest rates of 100 basis points and 300 basis points while funding spreads remain constant. This
analysis does not consider any potential impairment to our Residual Interests that may result from a higher
discount rate that would be used to compute the present value of the cash flows if long-term interest rates
increased. See Note 9 to the consolidated financial statements, “Student Loan Securitization,” which details the
potential decrease to fair value that could occur.
$%$%$%$%
Change from
Increase of
100 Basis
Points
Change from
Increase of
300 Basis
Points
Change from
Increase of
100 Basis
Points
Change from
Increase of
300 Basis
Points
Interest Rates: Interest Rates:
Year Ended December 31, 2006 Year Ended December 31, 2005
(Dollars in millions, except per share amounts)
Effect on Earnings
Increase/(decrease) in pre-tax net income before
unrealized gains (losses) on derivative and hedging
activities . . . . . . . . . . . . . . . . . . . . . . . . . . . . . . . . . $ (4) —% $ (20) (1)% $ 12 1% $ 14 1%
Unrealized gains (losses) on derivative and hedging
activities . . . . . . . . . . . . . . . . . . . . . . . . . . . . . . . . . 136 59 215 93 202 32 347 55
Increase in net income before taxes . . . . . . . . . . . . . . . . $ 132 7% $ 195 10% $ 214 10% $ 361 17%
Increase in diluted earnings per share . . . . . . . . . . . . . . $.213 8% $.352 13% $.323 11% $.580 19%
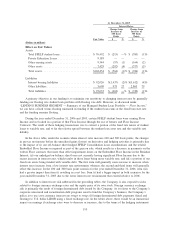
Fair Value $ % $ %
Change from
Increase of
100 Basis
Points
Change from
Increase of
300 Basis
Points
Interest Rates:
At December 31, 2006
(Dollars in millions)
Effect on Fair Values
Assets
Total FFELP student loans. . .................. $ 87,797 $ (182) —% $ (313) —%
Private Education Loans . . . .................. 12,063 — — — —
Other earning assets ........................ 9,950 (38) — (109) (1)
Other assets .............................. 10,299 (436) (4) (750) (7)
Total assets ............................... $120,109 $ (656) (1)% $(1,172) (1)%
Liabilities
Interest bearing liabilities . . .................. $108,142 $(1,427) (1)% $(3,610) (3)%
Other liabilities ............................ 3,680 877 24 2,613 71
Total liabilities ............................ $111,822 $ (550) —% $ (997) (1)%
109