Sallie Mae 2006 Annual Report Download - page 62
Download and view the complete annual report
Please find page 62 of the 2006 Sallie Mae annual report below. You can navigate through the pages in the report by either clicking on the pages listed below, or by using the keyword search tool below to find specific information within the annual report.-
 1
1 -
2
-
3
-
4
-
5
-
6
-
7
-
8
-
9
-
10
-
11
-
12
-
13
-
14
-
15
-
16
-
17
-
18
-
19
-
20
-
21
-
22
-
23
-
24
-
25
-
26
-
27
-
28
-
29
-
30
-
31
-
32
-
33
-
34
-
35
-
36
-
37
-
38
-
39
-
40
-
41
-
42
-
43
-
44
-
45
-
46
-
47
-
48
-
49
-
50
-
51
-
 52
52 -
 53
53 -
 54
54 -
 55
55 -
 56
56 -
 57
57 -
 58
58 -
 59
59 -
 60
60 -
 61
61 -
 62
62 -
 63
63 -
 64
64 -
 65
65 -
 66
66 -
 67
67 -
 68
68 -
 69
69 -
 70
70 -
 71
71 -
 72
72 -
73
-
74
-
75
-
76
-
77
-
78
-
79
-
80
-
81
-
82
-
83
-
84
-
85
-
86
-
87
-
88
-
89
-
90
-
91
-
92
-
93
-
94
-
95
-
96
-
97
-
98
-
99
-
100
-
101
-
102
-
103
-
104
-
105
-
106
-
107
-
108
-
109
-
110
-
111
-
112
-
113
-
114
-
115
-
116
-
117
-
118
-
119
-
120
-
121
-
122
-
123
-
124
-
125
-
126
-
127
-
128
-
129
-
130
-
131
-
132
-
133
-
134
-
135
-
136
-
137
-
138
-
139
-
140
-
141
-
142
-
143
-
144
-
145
-
146
-
147
-
148
-
149
-
150
-
151
-
152
-
153
-
154
-
155
-
156
-
157
-
158
-
159
-
160
-
161
-
162
-
163
-
164
-
165
-
166
-
167
-
168
-
169
-
170
-
171
-
172
-
173
-
174
-
175
-
176
-
177
-
178
-
179
-
180
-
181
-
182
-
183
-
184
-
185
-
186
-
187
-
188
-
189
-
190
-
191
-
192
-
193
-
194
-
195
-
196
-
197
-
198
-
199
-
200
-
201
-
202
-
203
-
204
-
205
-
206
-
207
-
208
-
209
-
210
-
211
-
212
-
213
-
214
-
215
 |
 |
• the level of Floor Income; and when considering the “Core Earnings” managed spread, the amount of
Floor Income-eligible loans that have been hedged through Floor Income Contracts; and
• funding and hedging costs.
The student loan spread is highly susceptible to liquidity, funding and interest rate risk. These risks are
discussed separately at “LIQUIDITY AND CAPITAL RESOURCES” and in the “RISK FACTORS” discussion
at the front of the document.
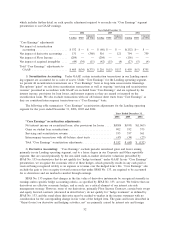
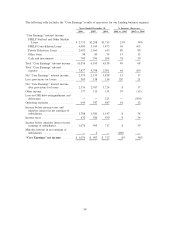
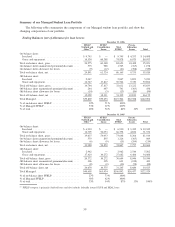
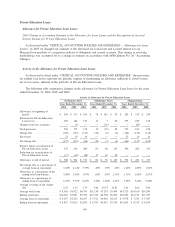
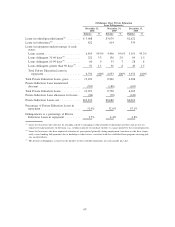
Student Loan Spread Analysis — “Core Earnings” Basis
The following table analyzes the earnings from our portfolio of Managed student loans on a “Core
Earnings” basis (see “BUSINESS SEGMENTS — Pre-tax Differences between ‘Core Earnings’ and GAAP by
Business Segment”). The “Core Earnings” Basis Student Loan Spread Analysis presentation and certain
components used in the calculation differ from the On-Balance Sheet Student Loan Spread Analysis
presentation. The “Core Earnings” basis presentation, when compared to our on-balance sheet presentation, is
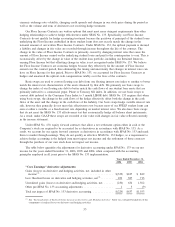
different in that it:
• includes the net interest margin related to our off-balance sheet student loan securitization trusts. This
includes any related fees or costs such as the Consolidation Loan Rebate Fees, premium/discount
amortization and Borrower Benefits yield adjustments;
• includes the reclassification of certain derivative net settlement amounts. The net settlements on certain
derivatives that do not qualify as SFAS No. 133 hedges are recorded as part of the “gain (loss) on
derivative and hedging activities, net” line item on the income statement and are therefore not
recognized in the student loan spread. Under this presentation, these gains and losses are reclassified to
the income statement line item of the economically hedged item. For our “Core Earnings” basis student
loan spread, this would primarily include: (a) reclassifying the net settlement amounts related to our
written Floor Income Contracts to student loan interest income and (b) reclassifying the net settlement
amounts related to certain of our basis swaps to debt interest expense;
• excludes unhedged Floor Income earned on the Managed student loan portfolio; and
• includes the amortization of upfront payments on Floor Income Contracts in student loan income that
we believe are economically hedging the Floor Income.
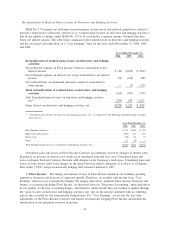
As discussed above, these differences result in the “Core Earnings” basis student loan spread not being a
GAAP-basis presentation. Management relies on this measure to manage our Lending business segment.
Specifically, management uses the “Core Earnings” basis student loan spread to evaluate the overall economic
effect that certain factors have on our student loans either on- or off-balance sheet. These factors include the
overall mix of student loans in our portfolio, acquisition costs, Borrower Benefits program costs, Floor Income
and funding and hedging costs. Management believes that it is important to evaluate all of these factors on a
“Core Earnings” basis to gain additional information about the economic effect of these factors on our student
loans under management. Management believes that this additional information assists us in making strategic
decisions about the Company’s business model for the Lending business segment, including among other
factors, how we acquire or originate student loans, how we fund acquisitions and originations, what Borrower
Benefits we offer and what type of loans we purchase or originate. While management believes that the “Core
Earnings” basis student loan spread is an important tool for evaluating the Company’s performance for the
reasons described above, it is subject to certain general and specific limitations that investors should carefully
consider. See “BUSINESS SEGMENTS — Limitations of ‘Core Earnings.’ ” One specific limitation is that the
61