Sallie Mae 2006 Annual Report Download - page 39
Download and view the complete annual report
Please find page 39 of the 2006 Sallie Mae annual report below. You can navigate through the pages in the report by either clicking on the pages listed below, or by using the keyword search tool below to find specific information within the annual report.-
 1
1 -
2
-
3
-
4
-
5
-
6
-
7
-
8
-
9
-
10
-
11
-
12
-
13
-
14
-
15
-
16
-
17
-
18
-
19
-
20
-
21
-
22
-
23
-
24
-
25
-
26
-
27
-
28
-
 29
29 -
 30
30 -
 31
31 -
 32
32 -
 33
33 -
 34
34 -
 35
35 -
 36
36 -
 37
37 -
 38
38 -
 39
39 -
 40
40 -
 41
41 -
 42
42 -
 43
43 -
 44
44 -
 45
45 -
 46
46 -
 47
47 -
 48
48 -
 49
49 -
50
-
51
-
52
-
53
-
54
-
55
-
56
-
57
-
58
-
59
-
60
-
61
-
62
-
63
-
64
-
65
-
66
-
67
-
68
-
69
-
70
-
71
-
72
-
73
-
74
-
75
-
76
-
77
-
78
-
79
-
80
-
81
-
82
-
83
-
84
-
85
-
86
-
87
-
88
-
89
-
90
-
91
-
92
-
93
-
94
-
95
-
96
-
97
-
98
-
99
-
100
-
101
-
102
-
103
-
104
-
105
-
106
-
107
-
108
-
109
-
110
-
111
-
112
-
113
-
114
-
115
-
116
-
117
-
118
-
119
-
120
-
121
-
122
-
123
-
124
-
125
-
126
-
127
-
128
-
129
-
130
-
131
-
132
-
133
-
134
-
135
-
136
-
137
-
138
-
139
-
140
-
141
-
142
-
143
-
144
-
145
-
146
-
147
-
148
-
149
-
150
-
151
-
152
-
153
-
154
-
155
-
156
-
157
-
158
-
159
-
160
-
161
-
162
-
163
-
164
-
165
-
166
-
167
-
168
-
169
-
170
-
171
-
172
-
173
-
174
-
175
-
176
-
177
-
178
-
179
-
180
-
181
-
182
-
183
-
184
-
185
-
186
-
187
-
188
-
189
-
190
-
191
-
192
-
193
-
194
-
195
-
196
-
197
-
198
-
199
-
200
-
201
-
202
-
203
-
204
-
205
-
206
-
207
-
208
-
209
-
210
-
211
-
212
-
213
-
214
-
215
 |
 |

calculate to those provided by our counterparties on a monthly basis. Any significant differences are identified
and resolved appropriately.
SFAS No. 133 requires that changes in the fair value of derivative instruments be recognized currently in
earnings unless specific hedge accounting criteria as specified by SFAS No. 133 are met. We believe that all
of our derivatives are effective economic hedges and are a critical element of our interest rate risk management
strategy. However, under SFAS No. 133, some of our derivatives, primarily Floor Income Contracts, certain
Eurodollar futures contracts, basis swaps and equity forwards, do not qualify for “hedge treatment” under
SFAS No. 133. Therefore, changes in market value along with the periodic net settlements must be recorded
through the “gains (losses) on derivative and hedging activities, net” line in the income statement with no
consideration for the corresponding change in fair value of the hedged item. The derivative market value
adjustment is primarily caused by interest rate and foreign currency exchange rate volatility, changing credit
spreads during the period, and changes in our stock price (related to equity forwards) as well as, the volume
and term of derivatives not receiving hedge accounting treatment. See also “BUSINESS SEGMENTS —
Limitations of ‘Core Earnings’ — Pre-tax Differences between ‘Core Earnings’ and GAAP by Business
Segment — Derivative Accounting” for a detailed discussion of our accounting for derivatives.
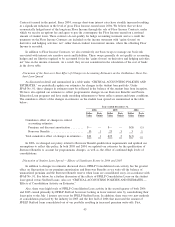
SELECTED FINANCIAL DATA
Condensed Statements of Income
2006 2005 2004 $ % $ %
Years Ended December 31, 2006 vs. 2005 2005 vs. 2004
Increase (Decrease)
Net interest income.................... $1,454 $1,451 $1,299 $ 3 —% $ 152 12%
Less: provisions for losses .............. 287 203 111 84 41 92 83
Net interest income after provisions for
losses ............................ 1,167 1,248 1,188 (81) (6) 60 5
Gains on student loan securitizations ....... 902 552 375 350 63 177 47
Servicing and securitization revenue ....... 553 357 561 196 55 (204) (36)
Losses on securities, net ................ (49) (64) (49) (15) (23) 15 31
Gains (losses) on derivative and hedging
activities, net ...................... (339) 247 849 (586) (237) (602) (71)
Guarantor servicing fees ................ 132 115 120 17 15 (5) (4)
Debt management fees ................. 397 360 300 37 10 60 20
Collections revenue ................... 240 167 39 73 44 128 328
Other income ........................ 338 273 290 65 24 (17) (6)
Operating expenses .................... 1,346 1,138 895 208 18 243 27
Loss on GSE debt extinguishment ......... — — 221 — — (221) (100)
Income taxes ........................ 834 729 642 105 14 87 14
Minority interest in net earnings of
subsidiaries ........................ 4 6 1 (2) — 5 500
Net income ......................... 1,157 1,382 1,914 (225) (16) (532) (28)
Preferred stock dividends ............... 36 22 12 14 64 10 83
Net income attributable to common stock . . . $1,121 $1,360 $1,902 $(239) (18)% $ (542) (28)%
Basic earnings per common share ......... $ 2.73 $ 3.25 $ 4.36 $ (.52) (16)% $(1.11) (25)%
Diluted earnings per common share........ $ 2.63 $ 3.05 $ 4.04 $ (.42) (14)% $ (.99) (25)%
Dividends per common share ............ $ .97 $ .85 $ .74 $ .12 14% $ .11 15%
38