Sallie Mae 2006 Annual Report Download - page 67
Download and view the complete annual report
Please find page 67 of the 2006 Sallie Mae annual report below. You can navigate through the pages in the report by either clicking on the pages listed below, or by using the keyword search tool below to find specific information within the annual report.-
 1
1 -
2
-
3
-
4
-
5
-
6
-
7
-
8
-
9
-
10
-
11
-
12
-
13
-
14
-
15
-
16
-
17
-
18
-
19
-
20
-
21
-
22
-
23
-
24
-
25
-
26
-
27
-
28
-
29
-
30
-
31
-
32
-
33
-
34
-
35
-
36
-
37
-
38
-
39
-
40
-
41
-
42
-
43
-
44
-
45
-
46
-
47
-
48
-
49
-
50
-
51
-
52
-
53
-
54
-
55
-
56
-
 57
57 -
 58
58 -
 59
59 -
 60
60 -
 61
61 -
 62
62 -
 63
63 -
 64
64 -
 65
65 -
 66
66 -
 67
67 -
 68
68 -
 69
69 -
 70
70 -
 71
71 -
 72
72 -
 73
73 -
 74
74 -
 75
75 -
 76
76 -
 77
77 -
78
-
79
-
80
-
81
-
82
-
83
-
84
-
85
-
86
-
87
-
88
-
89
-
90
-
91
-
92
-
93
-
94
-
95
-
96
-
97
-
98
-
99
-
100
-
101
-
102
-
103
-
104
-
105
-
106
-
107
-
108
-
109
-
110
-
111
-
112
-
113
-
114
-
115
-
116
-
117
-
118
-
119
-
120
-
121
-
122
-
123
-
124
-
125
-
126
-
127
-
128
-
129
-
130
-
131
-
132
-
133
-
134
-
135
-
136
-
137
-
138
-
139
-
140
-
141
-
142
-
143
-
144
-
145
-
146
-
147
-
148
-
149
-
150
-
151
-
152
-
153
-
154
-
155
-
156
-
157
-
158
-
159
-
160
-
161
-
162
-
163
-
164
-
165
-
166
-
167
-
168
-
169
-
170
-
171
-
172
-
173
-
174
-
175
-
176
-
177
-
178
-
179
-
180
-
181
-
182
-
183
-
184
-
185
-
186
-
187
-
188
-
189
-
190
-
191
-
192
-
193
-
194
-
195
-
196
-
197
-
198
-
199
-
200
-
201
-
202
-
203
-
204
-
205
-
206
-
207
-
208
-
209
-
210
-
211
-
212
-
213
-
214
-
215
 |
 |

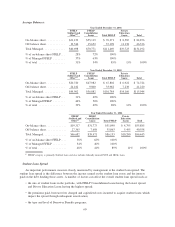
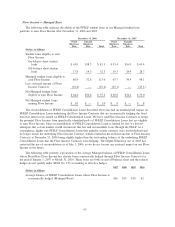
Private Education Loans
Allowance for Private Education Loan Losses
2005 Change in Accounting Estimate to the Allowance for Loan Losses and the Recognition of Accrued
Interest Income for Private Education Loans
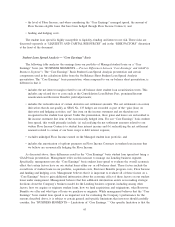
As discussed under “CRITICAL ACCOUNTING POLICIES AND ESTIMATES — Allowance for Loan
Losses,” in 2005 we changed our estimate of the allowance for loan losses and accrued interest for our
Managed loan portfolio to a migration analysis of delinquent and current accounts. This change in reserving
methodology was accounted for as a change in estimate in accordance with APB Opinion No. 20, “Accounting
Changes.”
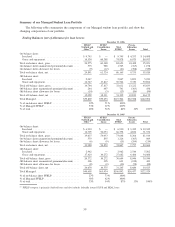
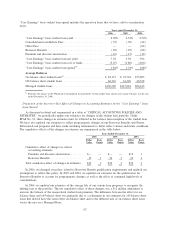
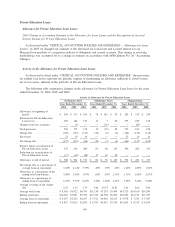
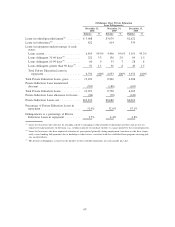
Activity in the Allowance for Private Education Loan Losses
As discussed in detail under “CRITICAL ACCOUNTING POLICIES AND ESTIMATES,” the provisions
for student loan losses represent the periodic expense of maintaining an allowance sufficient to absorb losses,
net of recoveries, inherent in the portfolio of Private Education Loans.
The following table summarizes changes in the allowance for Private Education Loan losses for the years
ended December 31, 2006, 2005 and 2004.
2006 2005 2004 2006 2005 2004 2006 2005 2004
Years Ended December 31, Years Ended December 31, Years Ended December 31,
On-Balance Sheet Off-Balance Sheet Managed Basis
Activity in Allowance for Private Education Loans
Allowance at beginning of
period. . . . . . . . . . . . . . . . . . . $ 204 $ 172 $ 166 $ 78 $ 143 $ 93 $ 282 $ 315 $ 259
Provision for Private Education
Loan losses . . . . . . . . . . . . . . . 258 186 130 15 3 28 273 189 158
Change in net loss estimates . . . . . — (9) — — (76) — — (85) —
Total provision . . . . . . . . . . . . . . 258 177 130 15 (73) 28 273 104 158
Charge-offs. . . . . . . . . . . . . . . . . (160) (154) (110) (24) (2) (6) (184) (156) (116)
Recoveries . . . . . . . . . . . . . . . . . 23 19 14 — — — 23 19 14
Net charge-offs . . . . . . . . . . . . . . (137) (135) (96) (24) (2) (6) (161) (137) (102)
Balance before securitization of
Private Education Loans . . . . . . 325 214 200 69 68 115 394 282 315
Reduction for securitization of
Private Education Loans . . . . . . (17) (10) (28) 17 10 28 — — —
Allowance at end of period. . . . . . $ 308 $ 204 $ 172 $ 86 $ 78 $ 143 $ 394 $ 282 $ 315
Net charge-offs as a percentage of
average loans in repayment . . . . 3.22% 4.14% 3.57% .43% .07% .22% 1.62% 1.89% 1.92%
Allowance as a percentage of the
ending total loan balance . . . . . 3.06% 2.56% 3.07% .66% .89% 2.31% 1.71% 1.69% 2.67%
Allowance as a percentage of
ending loans in repayment . . . . 6.36% 5.57% 6.05% 1.26% 1.68% 4.27% 3.38% 3.40% 5.08%
Average coverage of net charge-
offs . . . . . . . . . . . . . . . . . . . . 2.25 1.52 1.79 3.46 29.75 24.81 2.44 2.06 3.09
Average total loans . . . . . . . . . . . $ 8,585 $6,922 $4,795 $11,138 $7,238 $5,495 $19,723 $14,160 $10,290
Ending total loans . . . . . . . . . . . . $10,063 $7,961 $5,592 $12,919 $8,758 $6,205 $22,982 $16,719 $11,797
Average loans in repayment . . . . . $ 4,257 $3,252 $2,697 $ 5,721 $4,002 $2,611 $ 9,978 $ 7,254 $ 5,307
Ending loans in repayment . . . . . . $ 4,851 $3,662 $2,842 $ 6,792 $4,653 $3,352 $11,643 $ 8,315 $ 6,194
66