Sallie Mae 2006 Annual Report Download - page 45
Download and view the complete annual report
Please find page 45 of the 2006 Sallie Mae annual report below. You can navigate through the pages in the report by either clicking on the pages listed below, or by using the keyword search tool below to find specific information within the annual report.-
 1
1 -
2
-
3
-
4
-
5
-
6
-
7
-
8
-
9
-
10
-
11
-
12
-
13
-
14
-
15
-
16
-
17
-
18
-
19
-
20
-
21
-
22
-
23
-
24
-
25
-
26
-
27
-
28
-
29
-
30
-
31
-
32
-
33
-
34
-
 35
35 -
 36
36 -
 37
37 -
 38
38 -
 39
39 -
 40
40 -
 41
41 -
 42
42 -
 43
43 -
 44
44 -
 45
45 -
 46
46 -
 47
47 -
 48
48 -
 49
49 -
 50
50 -
 51
51 -
 52
52 -
 53
53 -
 54
54 -
 55
55 -
56
-
57
-
58
-
59
-
60
-
61
-
62
-
63
-
64
-
65
-
66
-
67
-
68
-
69
-
70
-
71
-
72
-
73
-
74
-
75
-
76
-
77
-
78
-
79
-
80
-
81
-
82
-
83
-
84
-
85
-
86
-
87
-
88
-
89
-
90
-
91
-
92
-
93
-
94
-
95
-
96
-
97
-
98
-
99
-
100
-
101
-
102
-
103
-
104
-
105
-
106
-
107
-
108
-
109
-
110
-
111
-
112
-
113
-
114
-
115
-
116
-
117
-
118
-
119
-
120
-
121
-
122
-
123
-
124
-
125
-
126
-
127
-
128
-
129
-
130
-
131
-
132
-
133
-
134
-
135
-
136
-
137
-
138
-
139
-
140
-
141
-
142
-
143
-
144
-
145
-
146
-
147
-
148
-
149
-
150
-
151
-
152
-
153
-
154
-
155
-
156
-
157
-
158
-
159
-
160
-
161
-
162
-
163
-
164
-
165
-
166
-
167
-
168
-
169
-
170
-
171
-
172
-
173
-
174
-
175
-
176
-
177
-
178
-
179
-
180
-
181
-
182
-
183
-
184
-
185
-
186
-
187
-
188
-
189
-
190
-
191
-
192
-
193
-
194
-
195
-
196
-
197
-
198
-
199
-
200
-
201
-
202
-
203
-
204
-
205
-
206
-
207
-
208
-
209
-
210
-
211
-
212
-
213
-
214
-
215
 |
 |

• the level of Floor Income and, when considering the “Core Earnings” spread, the amount of Floor
Income-eligible loans that have been hedged through Floor Income Contracts; and
• funding and hedging costs.
Wholesale Consolidation Loans
During 2006, we implemented a new loan acquisition strategy under which we began purchasing FFELP
Consolidation Loans outside of our normal origination channels, primarily via the spot market. We refer to
this new loan acquisition strategy as our Wholesale Consolidation Channel. FFELP Consolidation Loans
acquired through this channel are considered incremental volume to our core acquisition channels, which are
focused on the retail marketplace with an emphasis on our internal brand strategy. Wholesale Consolidation
Loans generally command significantly higher premiums than our originated FFELP Consolidation Loans, and
as a result, Wholesale Consolidation Loans have lower spreads. Since Wholesale Consolidation Loans are
acquired outside of our core loan acquisition channels and have different yields and return expectations than
the rest of our FFELP Consolidation Loan portfolio, we have excluded the impact of the Wholesale
Consolidation Loan volume from the student loan spread analysis to provide more meaningful period-over-per-
iod comparisons on the performance of our student loan portfolio. We will therefore discuss the volume and
its effect on the spread of the Wholesale Consolidation Loan portfolio separately.
The student loan spread is highly susceptible to liquidity, funding and interest rate risk. These risks are
discussed separately in “LIQUIDITY AND CAPITAL RESOURCES” and in the “RISK FACTORS”
discussion.
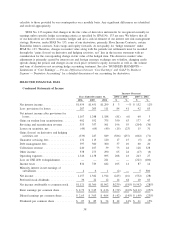
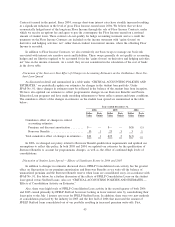
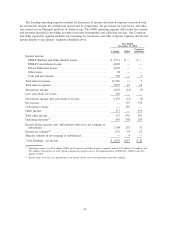
Student Loan Spread Analysis — On-Balance Sheet
The following table analyzes the reported earnings from on-balance sheet student loans. For an analysis
of our student loan spread for the entire portfolio of Managed student loans on a similar basis to the on-
balance sheet analysis, see “LENDING BUSINESS SEGMENT — Student Loan Spread Analysis — ‘Core
Earnings’ Basis.”
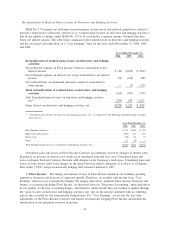
2006 2005 2004
Years Ended December 31,
On-Balance Sheet
Student loan yield, before Floor Income ..................... 7.94% 6.22% 4.53%
Gross Floor Income .................................... .04 .25 .73
Consolidation Loan Rebate Fees .......................... (.67) (.65) (.58)
Offset Fees . . . ....................................... — — (.03)
Borrower Benefits ..................................... (.12) (.11) (.18)
Premium and discount amortization ........................ (.14) (.16) (.13)
Student loan net yield .................................. 7.05 5.55 4.34
Student loan cost of funds ............................... (5.36) (3.69) (2.01)
Student loan spread
(1)
.................................. 1.69% 1.86% 2.33%
Average Balances
On-balance sheet student loans
(1)
.......................... $84,173 $74,724 $55,885
(1)
Excludes the impact of the Wholesale Consolidation Loan portfolio on the student loan spread and average balance for the year
ended December 31, 2006.
Discussion of Student Loan Spread — Effects of Floor Income and Derivative Accounting
In low interest rate environments, one of the primary drivers of fluctuations in our on-balance sheet
student loan spread is the level of gross Floor Income (Floor Income earned before payments on Floor Income
44